Unlock a world of possibilities! Login now and discover the exclusive benefits awaiting you.
- Qlik Community
- :
- All Forums
- :
- QlikView App Dev
- :
- Re: average of top 3
- Subscribe to RSS Feed
- Mark Topic as New
- Mark Topic as Read
- Float this Topic for Current User
- Bookmark
- Subscribe
- Mute
- Printer Friendly Page
- Mark as New
- Bookmark
- Subscribe
- Mute
- Subscribe to RSS Feed
- Permalink
- Report Inappropriate Content
average of top 3
Hi,
I have a table with 3 dimensions
- category
- code
- period
and a value
- value
how can I get per each code and period the average of the top 3 from the category
I have attached the qvw with the data
thanks for any help
- « Previous Replies
-
- 1
- 2
- Next Replies »
- Mark as New
- Bookmark
- Subscribe
- Mute
- Subscribe to RSS Feed
- Permalink
- Report Inappropriate Content
see my attached document. There is a cross table
- Mark as New
- Bookmark
- Subscribe
- Mute
- Subscribe to RSS Feed
- Permalink
- Report Inappropriate Content
I'm not sure how much clearer I can make it that you can't use a cross table. You need to user the Qlikview wizard and take it out of cross table format.
The data should look like:
Category Code Period Score
A 100 1 59
A 200 1 40
A 200 2 45
B 100 1 70
Not Category Code Period1 Period 2 Period3 Period4
- Mark as New
- Bookmark
- Subscribe
- Mute
- Subscribe to RSS Feed
- Permalink
- Report Inappropriate Content
Hi Mario I don't understand your last formula
The average must be for all codes of this category 38.33
see attached excel
- Mark as New
- Bookmark
- Subscribe
- Mute
- Subscribe to RSS Feed
- Permalink
- Report Inappropriate Content
i have changed the format of the data (no crosstab any more)
Still the formula doesn't bring a result
- Mark as New
- Bookmark
- Subscribe
- Mute
- Subscribe to RSS Feed
- Permalink
- Report Inappropriate Content
Can you kindly attach the file ttt.xlsx ?
- Mark as New
- Bookmark
- Subscribe
- Mute
- Subscribe to RSS Feed
- Permalink
- Report Inappropriate Content
enclosed
- Mark as New
- Bookmark
- Subscribe
- Mute
- Subscribe to RSS Feed
- Permalink
- Report Inappropriate Content
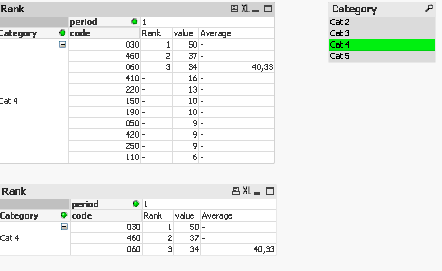
Expression formula is
IF (rank(Aggr(avg(value),Category,code,period),0,1) =3 ,
rangeavg (above(avg(value),0,3))
)
enclosed a solution and a straight table not showing 0 values.
Regards,
- « Previous Replies
-
- 1
- 2
- Next Replies »