Unlock a world of possibilities! Login now and discover the exclusive benefits awaiting you.
- Qlik Community
- :
- All Forums
- :
- QlikView App Dev
- :
- Re: dates range in set analysis
- Subscribe to RSS Feed
- Mark Topic as New
- Mark Topic as Read
- Float this Topic for Current User
- Bookmark
- Subscribe
- Mute
- Printer Friendly Page
- Mark as New
- Bookmark
- Subscribe
- Mute
- Subscribe to RSS Feed
- Permalink
- Report Inappropriate Content
dates range in set analysis
Hi
I have a pivot table with Date as my dimension.
I would like it to calculate based on each Date record in my dimension in my pivot table…
So for example rows in my pivot table look like:
Date Count
2016-08-01, 10 (count aggregated from 2016-7-25 to 2016-08-01)
2016-08-02, 8 (count aggregated from 2016-7-26 to 2016-08-02)
2016-08-03, 23 (count aggregated from 2016-7-27 to 2016-08-03)
I don't know how I should create my expression using set analysis. I tried different things like 'Count( {$< Date = {‘>=$(=max(Date)-7)<=$(=max(Date))’} , Date =>} Field1)'. But nothing worked.
Please help!
Thank yo
- « Previous Replies
-
- 1
- 2
- Next Replies »
- Mark as New
- Bookmark
- Subscribe
- Mute
- Subscribe to RSS Feed
- Permalink
- Report Inappropriate Content
Thank you very much Sunny! can you please explain how it works?
In the example it worked fine for certain cell but not all. So in the example, i only inserted one error record where it's registered more than 7 days before. So the final result compare to previous count should be 1 count less in each hour for each day. Although i have seen many cells turn to be more counts less which shouldn't be the case.
But thank you so much for helping me along the way!
- Mark as New
- Bookmark
- Subscribe
- Mute
- Subscribe to RSS Feed
- Permalink
- Report Inappropriate Content
So, this isn't working perfectly in all cases? May be if you can point out those places where it doesn't work, we might be able to take a look at this.
Now that I am looking at this, the expression might need a DISTINCT in there to work
=Count(Aggr(If(Count(DISTINCT Total <Patient> FullDate) <= 7, Patient), FullDate, Day, Hour, Patient))
Can you check if that resolves all your issues. I can go over the details of what this expression is doing in my next response.
Best,
Sunny
- Mark as New
- Bookmark
- Subscribe
- Mute
- Subscribe to RSS Feed
- Permalink
- Report Inappropriate Content
Thanks Sunny, but that expression doesn't really work still. In my example, my data represents from time of patients going into emergency room(registration) to when they leave (disposition). So normally duration of patient in ER won't be longer than 7 days. So i added 1 abnorrnal record:
Patient Id : 2265638 where it's registered in 2015 and disposed in 2016, this is an error. My purpose is that i need to implement the logic so that this abnormal record is filtered out in chart, so the end result will be only 1 count less for every day every hour than if it were not filtered out.
Not sure if i'm explained what i was trying to do.
Please let me know.
Thanks!
LeeAnn
- Mark as New
- Bookmark
- Subscribe
- Mute
- Subscribe to RSS Feed
- Permalink
- Report Inappropriate Content
But isn't that what it did in the example where you added that patient id: 2265638? it counted one less patient? I think your last sample did not include 2265638, that is why we don't see any difference, but if it was there we would have seen one less patient

- Mark as New
- Bookmark
- Subscribe
- Mute
- Subscribe to RSS Feed
- Permalink
- Report Inappropriate Content
thanks Sunny!!... i added the patient 2265638 in to my sample... please see attached...
- Mark as New
- Bookmark
- Subscribe
- Mute
- Subscribe to RSS Feed
- Permalink
- Report Inappropriate Content
I made a slight change, may be this is what was causing the issue:
=Count(Aggr(If(Count({1}Total <Patient> FullDate) <= 7, Patient), FullDate, Day, Hour, Patient))
- Mark as New
- Bookmark
- Subscribe
- Mute
- Subscribe to RSS Feed
- Permalink
- Report Inappropriate Content
Hi Sunny,
I used your last expression, still didn't work.
I inserted one wrong record and my expected result is that the count in Before column is always 1 count more than the After Column.
Currently it's variant and i'm not sure what the expression is doing:
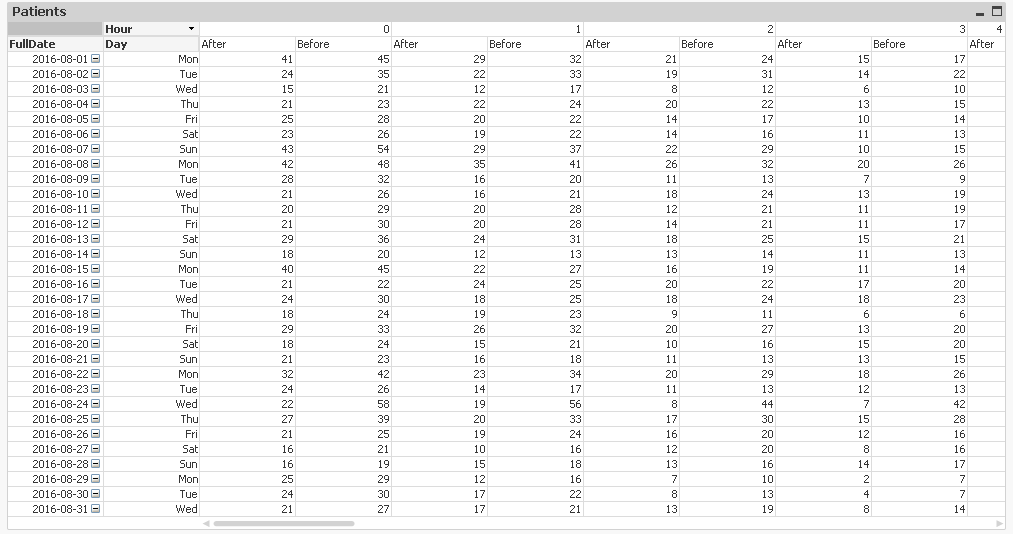
Thanks!!
LeeAnn
- Mark as New
- Bookmark
- Subscribe
- Mute
- Subscribe to RSS Feed
- Permalink
- Report Inappropriate Content
I guess I am not sure what exactly isn't working. If we can drill down to a very specific range of data and if you can explain what isn't matching, I might be able to help. I am sorry, I have not been very helpful thus far, but I am not sure what exactly is missing 
Other alternative would be to wait for someone else to respond
- Mark as New
- Bookmark
- Subscribe
- Mute
- Subscribe to RSS Feed
- Permalink
- Report Inappropriate Content
Hi Sunny,
No worries, thanks very much for the help along the way!!
LeeAnn
- « Previous Replies
-
- 1
- 2
- Next Replies »