Unlock a world of possibilities! Login now and discover the exclusive benefits awaiting you.
- Qlik Community
- :
- All Forums
- :
- QlikView App Dev
- :
- Re: display informtion when hovering over croostab...
- Subscribe to RSS Feed
- Mark Topic as New
- Mark Topic as Read
- Float this Topic for Current User
- Bookmark
- Subscribe
- Mute
- Printer Friendly Page
- Mark as New
- Bookmark
- Subscribe
- Mute
- Subscribe to RSS Feed
- Permalink
- Report Inappropriate Content
display informtion when hovering over croostab expression
I created a crosstab reporting average numbers. I would like to show additional information when hoovering over a number . For example the number of respondents to a survey.
Can not find an option like that. Is it possible ?
- « Previous Replies
-
- 1
- 2
- Next Replies »
- Mark as New
- Bookmark
- Subscribe
- Mute
- Subscribe to RSS Feed
- Permalink
- Report Inappropriate Content
Hi Curious,
you can use text popup, see the attached example where it's used on a bar chart.
Andy
- Mark as New
- Bookmark
- Subscribe
- Mute
- Subscribe to RSS Feed
- Permalink
- Report Inappropriate Content
I did find that option for a chart, but there is not such option fot a crosstab
- Mark as New
- Bookmark
- Subscribe
- Mute
- Subscribe to RSS Feed
- Permalink
- Report Inappropriate Content
What do you actually mean by a CrossTab?
Andy
- Mark as New
- Bookmark
- Subscribe
- Mute
- Subscribe to RSS Feed
- Permalink
- Report Inappropriate Content
I presume you mean a pivot table, you can't do it by hovering over one of the 'normal values' , but if you convert the supplied example, to a pivot, you can see that you get an extra POP column, that you may be able to utilise.
Andy
- Mark as New
- Bookmark
- Subscribe
- Mute
- Subscribe to RSS Feed
- Permalink
- Report Inappropriate Content
I use the total row of the table for that with a condition in the expression you can specify a different calculation e.g. something like
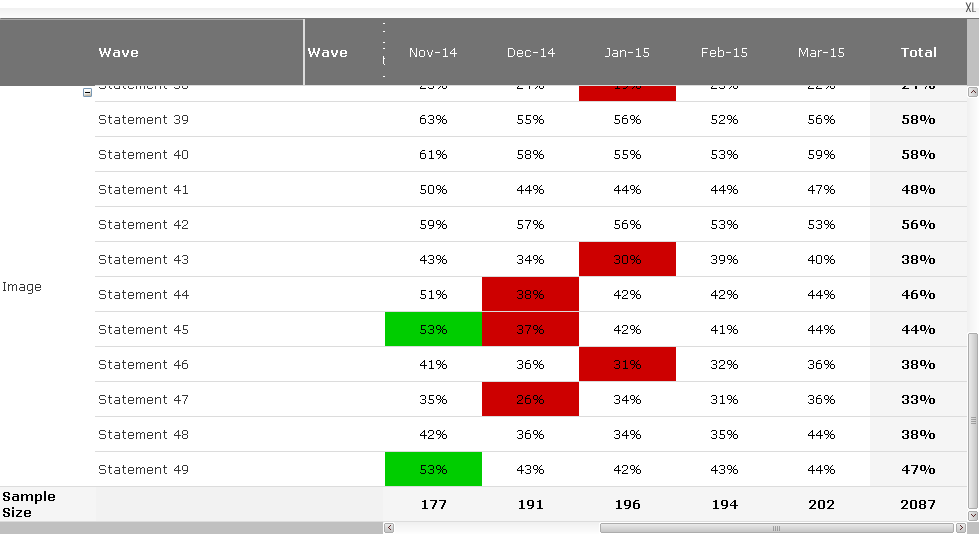
if(Rowno()=0 and Dimensionality()=0,'n='&Count(ID),YourExpression)
An other option is to add the n= expression to the label of the expression you are using, so it is showing in the header.
(Next to adding new columns with an extra expression offcourse)
- Mark as New
- Bookmark
- Subscribe
- Mute
- Subscribe to RSS Feed
- Permalink
- Report Inappropriate Content
Sorry I mean a Pivot Table. I try to avoid extra columns and the "hoover value" has to be presented and calculated for every "normal value"
@Andrew, which supplied example are you reffering to ?
- Mark as New
- Bookmark
- Subscribe
- Mute
- Subscribe to RSS Feed
- Permalink
- Report Inappropriate Content
There's a qvw attached to my original reply ![]()
- Mark as New
- Bookmark
- Subscribe
- Mute
- Subscribe to RSS Feed
- Permalink
- Report Inappropriate Content
No you can't without the extra columns (no hoover). Using my option it would like something like this

N.B. Werk je voor een marktonderzoekbureau?
- Mark as New
- Bookmark
- Subscribe
- Mute
- Subscribe to RSS Feed
- Permalink
- Report Inappropriate Content
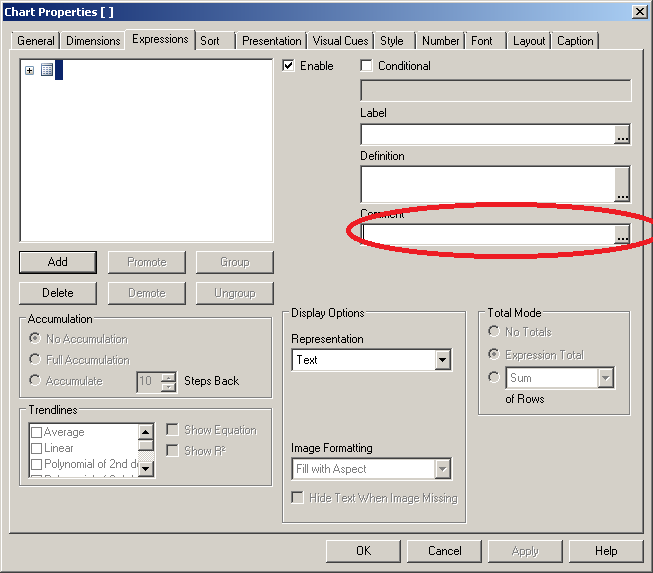
add the desired text to the comment of each expression:

- « Previous Replies
-
- 1
- 2
- Next Replies »