Unlock a world of possibilities! Login now and discover the exclusive benefits awaiting you.
- Qlik Community
- :
- All Forums
- :
- QlikView App Dev
- :
- Re: Re: Re: error un calc avg in graph
- Subscribe to RSS Feed
- Mark Topic as New
- Mark Topic as Read
- Float this Topic for Current User
- Bookmark
- Subscribe
- Mute
- Printer Friendly Page
- Mark as New
- Bookmark
- Subscribe
- Mute
- Subscribe to RSS Feed
- Permalink
- Report Inappropriate Content
error un calc avg in graph
hello
i have a table with 3 fields Month, date1 and date2. I need to show a bar chart agregated by month that show the avg of days between two date fields.
In dimension i define the field month, in expresion i put the next expresion:
num(avg(H_MFECHA-H_MFECHA2),'####,##',',','.')
the result of the avg in the bar chart are wrong.
somebody know what is wrong??
- « Previous Replies
-
- 1
- 2
- Next Replies »
- Mark as New
- Bookmark
- Subscribe
- Mute
- Subscribe to RSS Feed
- Permalink
- Report Inappropriate Content
Difficult to say without a data sample. One problem could be that the two dates aren't correctly interpreted as dates. Another possibility is that you have NULL values in the date fields.
To debug, I would start by removing the Num() function, and see what I get when I use
Avg(H_MFECHA-H_MFECHA2)
Avg(H_MFECHA)
Avg(H_MFECHA2)
Avg(RangeSum(H_MFECHA,-H_MFECHA2))
HIC
- Mark as New
- Bookmark
- Subscribe
- Mute
- Subscribe to RSS Feed
- Permalink
- Report Inappropriate Content
Hello
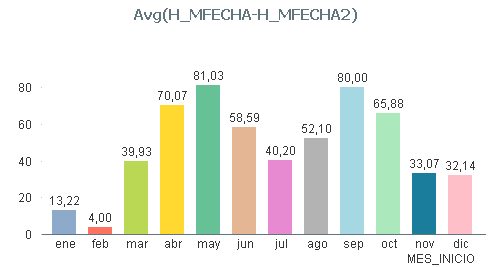
i have two files, one an excel with a example data set , in excel i have calculated the avg for the month abrl = 70,0714 but in the bar chart qv show 61,26, and for the month may = 81,03125 but QV show 66,29.
i have attached a pptx file with two screenshot of the qv barchart
thanks in advance for your help
regards
diego
- Mark as New
- Bookmark
- Subscribe
- Mute
- Subscribe to RSS Feed
- Permalink
- Report Inappropriate Content
Dear DcD,
In above situation you can use Month as Dimension and
Try below expression
=Avg(Interval(Date2-Date1,'D hh:mm'))
Regards
Kiran
- Mark as New
- Bookmark
- Subscribe
- Mute
- Subscribe to RSS Feed
- Permalink
- Report Inappropriate Content
When I load your Excel file into QlikView, I get the same numbers as you have in the Excel file:
April = 70.07
May = 81.03
So, it is something you do in your QlikView load script...
HIC
- Mark as New
- Bookmark
- Subscribe
- Mute
- Subscribe to RSS Feed
- Permalink
- Report Inappropriate Content
hello
the expresion =Avg(Interval(Date2-Date1,'D hh:mm')) don't work,
thanks for your help
regards
diego
- Mark as New
- Bookmark
- Subscribe
- Mute
- Subscribe to RSS Feed
- Permalink
- Report Inappropriate Content
hello
It's possible that the problem occurr when (H_MFECHA-H_MFECHA2)=0
i have attached another file with sample data, in excel the value of the avg is 51,63 but in QV bar chart is 77
is there any way to make the expresion to say that avg take also the records with value 0.
thanks in advance for your help
regards
diego
- Mark as New
- Bookmark
- Subscribe
- Mute
- Subscribe to RSS Feed
- Permalink
- Report Inappropriate Content
No, its not. When I load this new Excel file into QlikView, I get 51,63 also in QlikView. So, QlikView includes the zeros in the calculation. There must be something in your load script or in your bar chart that alters the data. Can you post your QlikView file?
HIC

- Mark as New
- Bookmark
- Subscribe
- Mute
- Subscribe to RSS Feed
- Permalink
- Report Inappropriate Content
hello Henric
i'm doing something wrong, i have created a new qv document with the excel thad i have attached abobe and my qv report grong result 77
i have attached que qv file.
regards
diego
- Mark as New
- Bookmark
- Subscribe
- Mute
- Subscribe to RSS Feed
- Permalink
- Report Inappropriate Content
Your Excel file uses the DD/MM/YYYY format on dates, but you have US date format in your script:
SET DateFormat='M/D/YYYY';
SET TimestampFormat='M/D/YYYY h:mm:ss[.fff] TT';
SET MonthNames='Jan;Feb;Mar;Apr;May;Jun;Jul;Aug;Sep;Oct;Nov;Dec';
SET DayNames='Mon;Tue;Wed;Thu;Fri;Sat;Sun';
This means that some dates are misinterpreted and the diffs between dates are calculated incorrectly.
Change your script to proper Spanish settings:
SET DateFormat='DD/MM/YYYY';
SET TimestampFormat='DD/MM/YYYY hh:mm:ss[.fff] TT';
SET MonthNames='ene;feb;mar;abr;may;jun;jul;ago;sep;oct;nov;dic';
SET DayNames='lun;mar;mié;jue;vie;sáb;dom';
If you change the regional settings in Windows, QlikView will use these for new documents.
HIC
- « Previous Replies
-
- 1
- 2
- Next Replies »