Unlock a world of possibilities! Login now and discover the exclusive benefits awaiting you.
- Qlik Community
- :
- All Forums
- :
- QlikView App Dev
- :
- Re: group data and calculations of a pivot table
- Subscribe to RSS Feed
- Mark Topic as New
- Mark Topic as Read
- Float this Topic for Current User
- Bookmark
- Subscribe
- Mute
- Printer Friendly Page
- Mark as New
- Bookmark
- Subscribe
- Mute
- Subscribe to RSS Feed
- Permalink
- Report Inappropriate Content
group data and calculations of a pivot table
With the help of forums,
I Create a Pivot Table with Item and MonthYear as Dimension and Sum(Quantity) as expression And this is the result:
| item | Monthyear | ene 2015 | feb 2015 | mar 2015 | abr 2015 | may 2015 | Total |
| 88126 | 1 | 30 | 87 | 0 | 0 | 130 | |
| 91152 | 143 | 97 | 136 | 206 | 82 | 976 | |
| 91156 | 162 | 66 | 154 | 129 | 120 | 1006 | |
| 91158 | 13 | 22 | 19 | 25 | 25 | 175 | |
| 91159 | 19 | 42 | 77 | 34 | 54 | 256 | |
| 91230 | 8 | 33 | 46 | 48 | 52 | 267 | |
| 91232 | 0 | 0 | 0 | 0 | 0 | 1 |
Now, I already have as well as the months I mean, how do I add January and February, February and March, March and April and so on. I need to add two and two and leave the results in a column. Because then I get the standard deviation of the months grouped in pairs.
I need this?
| item | Monthyear | ene 2015 | feb 2015 | mar 2015 | abr 2015 | may 2015 | jan+feb | feb+mar | mar+apr | Standard deviation |
| 88126 | 1 | 30 | 87 | 0 | 0 | 31 | 117 | 87 | 44 | |
| 91152 | 143 | 97 | 136 | 206 | 82 | 240 | 233 | 342 | 61 | |
| 91156 | 162 | 66 | 154 | 129 | 120 | 228 | 220 | 283 | 34 | |
| 91158 | 13 | 22 | 19 | 25 | 25 | 35 | 41 | 44 | 5 | |
| 91159 | 19 | 42 | 77 | 34 | 54 | 61 | 119 | 111 | 31 | |
| 91230 | 8 | 33 | 46 | 48 | 52 | 41 | 79 | 94 | 27 | |
| 91232 | 0 | 0 | 0 | 0 | 0 | 0 | 0 | 0 | 0 |
Please help me as I do this?
- « Previous Replies
-
- 1
- 2
- Next Replies »
- Mark as New
- Bookmark
- Subscribe
- Mute
- Subscribe to RSS Feed
- Permalink
- Report Inappropriate Content
One way to do is to use Column() function:
So for jan+feb - Column(1) + Column(2)
for feb+mar - Column(2) + Column(3)
for mar+apr - Column(3) + Column(4)
Mind you that I am assuming that ene 2015 is an expression and it is the first expression in your pivot table.
Hope this helps.
- Mark as New
- Bookmark
- Subscribe
- Mute
- Subscribe to RSS Feed
- Permalink
- Report Inappropriate Content
Thanks, but where it is placed to function? as expressions?
- Mark as New
- Bookmark
- Subscribe
- Mute
- Subscribe to RSS Feed
- Permalink
- Report Inappropriate Content
You just need to create another expression, please see below:
The below is for jan+feb.
- Mark as New
- Bookmark
- Subscribe
- Mute
- Subscribe to RSS Feed
- Permalink
- Report Inappropriate Content
Thank you very much for your help, I appreciate very much your comments,
I have Pivot Table with Item (codigo) and MonthYear as Dimension and Sum(Quantity) as expression And this is the result (dimensions):

After leading the column function, I have this:

Please help me again, as I do to disaggregate for months as you shown in the picture
Best regards,
Rodrigo Restrepo
- Mark as New
- Bookmark
- Subscribe
- Mute
- Subscribe to RSS Feed
- Permalink
- Report Inappropriate Content
Hi Rodrigo,
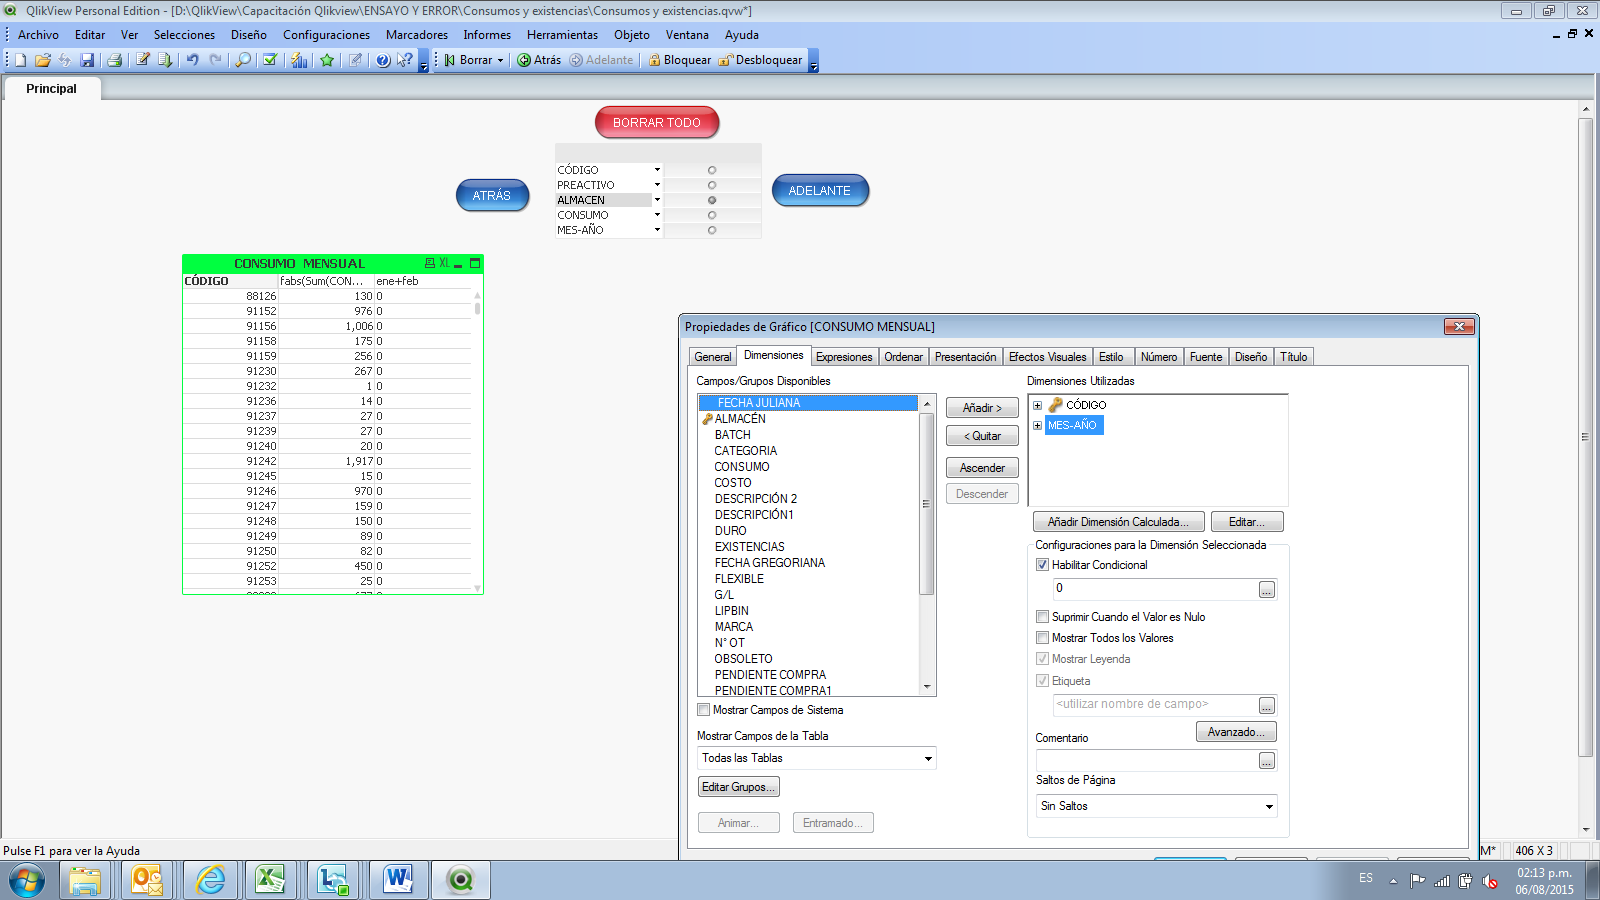
Either remove that dimension or hide it by using "Enable Conditional":
0 will hide this dimension and 1 will un-hide it.
Hope this helps.
- Mark as New
- Bookmark
- Subscribe
- Mute
- Subscribe to RSS Feed
- Permalink
- Report Inappropriate Content
Hi Sinan Ozdemir,
To remove the dimension column I lose months

How else I can take months in columns without him as dimension, that I have because every month are in one column and the column I need is a month.
Thanks, I appreciate your help, you know a lot and I'm just learning
- Mark as New
- Bookmark
- Subscribe
- Mute
- Subscribe to RSS Feed
- Permalink
- Report Inappropriate Content
Maybe use it within an expression like the below and then promote it to the top:
- Mark as New
- Bookmark
- Subscribe
- Mute
- Subscribe to RSS Feed
- Permalink
- Report Inappropriate Content
Hi Sinan,
I already did and I have this

I can do more
- Mark as New
- Bookmark
- Subscribe
- Mute
- Subscribe to RSS Feed
- Permalink
- Report Inappropriate Content
Sinan is suggesting the attached one -
- « Previous Replies
-
- 1
- 2
- Next Replies »