Unlock a world of possibilities! Login now and discover the exclusive benefits awaiting you.
- Qlik Community
- :
- All Forums
- :
- QlikView App Dev
- :
- Re: highlight the background color max/min of 2 di...
- Subscribe to RSS Feed
- Mark Topic as New
- Mark Topic as Read
- Float this Topic for Current User
- Bookmark
- Subscribe
- Mute
- Printer Friendly Page
- Mark as New
- Bookmark
- Subscribe
- Mute
- Subscribe to RSS Feed
- Permalink
- Report Inappropriate Content
highlight the background color max/min of 2 dimensions (on a pivot table)
Hi,
I need to highlight the background color max/min sales Type and Size dimensions.
I have so far doing this:
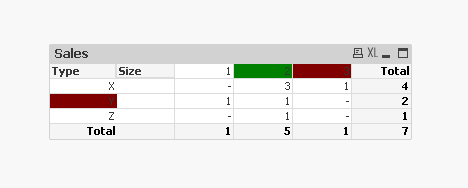
But, I need this:
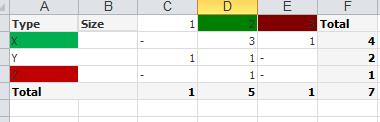
my expression: only({<Type={"=rank(aggr(sum({< Article={'AAA'}>}Sales),Type))=1"}>}Type) returns X as max type dimension, which is correct, but it doens't apply the background color, why??
I have attached a qvw file to understand better my pb.
Could someone please help on this,
Thanks in advance,
CAFC
- Mark as New
- Bookmark
- Subscribe
- Mute
- Subscribe to RSS Feed
- Permalink
- Report Inappropriate Content
If you like use rank to find min of some expression, you may use the same, but multipy your expression by -1.
regards
Darek
- Mark as New
- Bookmark
- Subscribe
- Mute
- Subscribe to RSS Feed
- Permalink
- Report Inappropriate Content
thanks for you reply.
if I select only the sizes 2 and 3 my expressions work great (for max and min cases), as you can see in the following picture:
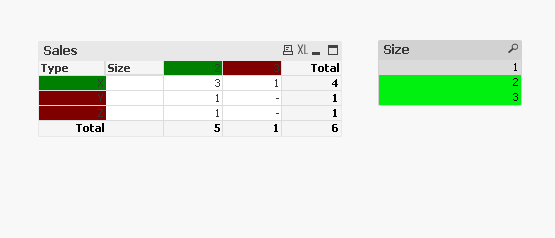
but, if I make no selection at all (like the first picture posted) my expression doesn't works correctly.
So, my conclusion is that when the Type dimension doesn't have data (minus signal) on Size 1 it not highlight min Type background color.
Is there any workaround to solve this pb (without changing loading data)?
thanks in advance,
CAFC
- Mark as New
- Bookmark
- Subscribe
- Mute
- Subscribe to RSS Feed
- Permalink
- Report Inappropriate Content
I have two dimensions EmployeeID & CategoryName and the measure is Sales.
And i want Max & Min Column of each category to be highligted min & max value employeeID wise. then write:
If(Rank( Sum(Sales))=1 ,Yellow(),
If(Rank(-Sum(Sales))=1,Green() ))
All your Min and max value will be highlited by Yellow and green respectively for each employeeID