Unlock a world of possibilities! Login now and discover the exclusive benefits awaiting you.
- Qlik Community
- :
- All Forums
- :
- QlikView App Dev
- :
- how? calculating % by dividing total for year by a...
- Subscribe to RSS Feed
- Mark Topic as New
- Mark Topic as Read
- Float this Topic for Current User
- Bookmark
- Subscribe
- Mute
- Printer Friendly Page
- Mark as New
- Bookmark
- Subscribe
- Mute
- Subscribe to RSS Feed
- Permalink
- Report Inappropriate Content
how? calculating % by dividing total for year by avg of totals from past months same fy year
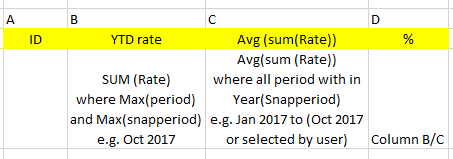
how do i achieve this? I need to calculate % by dividing total for year by avg of totals from past months same fy year
sample data file attached
Accepted Solutions
- Mark as New
- Bookmark
- Subscribe
- Mute
- Subscribe to RSS Feed
- Permalink
- Report Inappropriate Content
I guess you're missing the point of set analysis, if you combine both expression into one, it gets the same result, I just assumed you needed to see both values independently, but you can get only one expression with the two I put on the graph, giving the following:
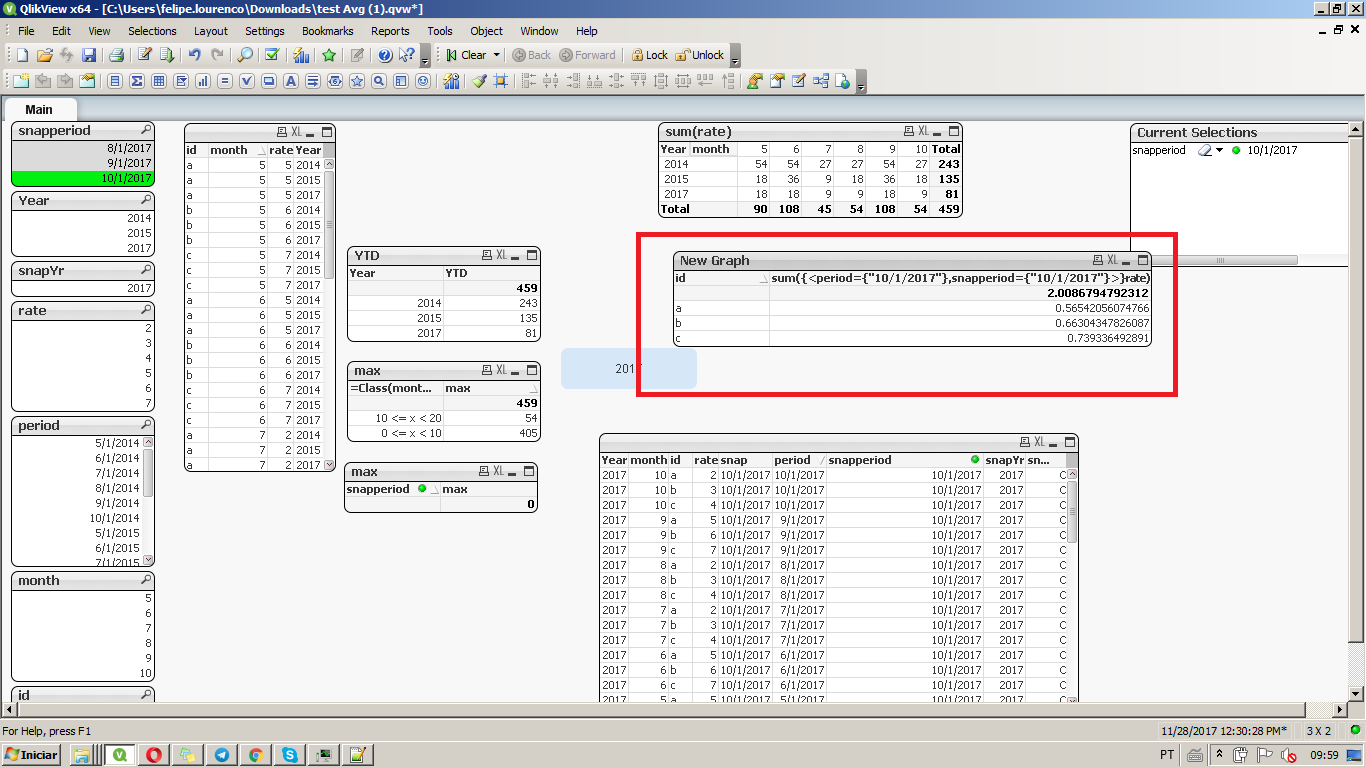
Set analysis let's you get a specific selection of data, even though there's a different selection made by the user.
Felipel.
- Mark as New
- Bookmark
- Subscribe
- Mute
- Subscribe to RSS Feed
- Permalink
- Report Inappropriate Content
Hi Rashid,
Both can be achieved through set analysis, being:
Column B (gets the max period and snapperiod or selected by user):
sum({<period={"$(=max(period))"},snapperiod={"$(=max(snapperiod))"}>}rate)
Column C (gets the year interval to max snapperiod or selected snapperiod:
avg({<snapperiod={">=$(=Yearstart(max(snapperiod)))<=$(=max(snapperiod))"}>}rate)
and Column 😧
// It only gets the previous stated expressions and does the percentage
Column(1)/Column(2)
Attachedt he file you provided with teh "New Graph" table, wich holds the above expression.
Felipe.
- Mark as New
- Bookmark
- Subscribe
- Mute
- Subscribe to RSS Feed
- Permalink
- Report Inappropriate Content
this works when columns are calculated separately, what if I have one expression in the pivot table and different partial sum sort of like
Year | Color | STatus> Active | Inactive | Status Total | Year total
now in this I want to divide Status total /Year Total
- Mark as New
- Bookmark
- Subscribe
- Mute
- Subscribe to RSS Feed
- Permalink
- Report Inappropriate Content
I guess you're missing the point of set analysis, if you combine both expression into one, it gets the same result, I just assumed you needed to see both values independently, but you can get only one expression with the two I put on the graph, giving the following:
Set analysis let's you get a specific selection of data, even though there's a different selection made by the user.
Felipel.