Unlock a world of possibilities! Login now and discover the exclusive benefits awaiting you.
- Qlik Community
- :
- All Forums
- :
- QlikView App Dev
- :
- how to average of 3 products wrt each other.
- Subscribe to RSS Feed
- Mark Topic as New
- Mark Topic as Read
- Float this Topic for Current User
- Bookmark
- Subscribe
- Mute
- Printer Friendly Page
- Mark as New
- Bookmark
- Subscribe
- Mute
- Subscribe to RSS Feed
- Permalink
- Report Inappropriate Content
how to average of 3 products wrt each other.
| Product | Values |
| FO | 23 |
| RX | 766 |
| TT | 1233 |
I have a requirement where I need to show average values for FO, RX, TT with respect to each other in an qlikview expression.
don't know if we can create it with the help of set analysis or aggr function.
Like my total is 2022 so FO would be 23/2022=.011% likewise.
could you please help here.
Accepted Solutions
- Mark as New
- Bookmark
- Subscribe
- Mute
- Subscribe to RSS Feed
- Permalink
- Report Inappropriate Content
Hello Harpreet,
Trust you are doing good!
To average values for each product please use Sum(Value)/Sum(TOTAL Value) expression and further modify it using Num() function as per your need.
I hope this will be helpful.
Thank you!
Rahul
- Mark as New
- Bookmark
- Subscribe
- Mute
- Subscribe to RSS Feed
- Permalink
- Report Inappropriate Content
May be by using this expression
Dim as Product
Expressions are
1) Sum(Values)
2) Sum(Values)/Sum(TOTAL Values)
And then goto Number Tab then use this for fixed to 3 decimals (#,##0.000)
- Mark as New
- Bookmark
- Subscribe
- Mute
- Subscribe to RSS Feed
- Permalink
- Report Inappropriate Content
Hi,
Use this
=avg(Aggr(Values,Product)) or you can use simply avg(Values)
- Mark as New
- Bookmark
- Subscribe
- Mute
- Subscribe to RSS Feed
- Permalink
- Report Inappropriate Content
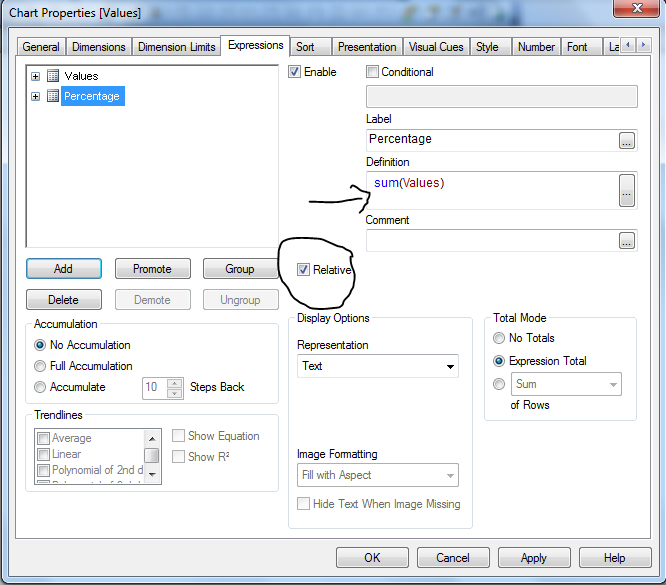
Hi Try like this:
- Mark as New
- Bookmark
- Subscribe
- Mute
- Subscribe to RSS Feed
- Permalink
- Report Inappropriate Content
Hello Harpreet,
Trust you are doing good!
To average values for each product please use Sum(Value)/Sum(TOTAL Value) expression and further modify it using Num() function as per your need.
I hope this will be helpful.
Thank you!
Rahul