Unlock a world of possibilities! Login now and discover the exclusive benefits awaiting you.
- Qlik Community
- :
- All Forums
- :
- QlikView App Dev
- :
- Re: how to findout the new and repeated mails w.r....
- Subscribe to RSS Feed
- Mark Topic as New
- Mark Topic as Read
- Float this Topic for Current User
- Bookmark
- Subscribe
- Mute
- Printer Friendly Page
- Mark as New
- Bookmark
- Subscribe
- Mute
- Subscribe to RSS Feed
- Permalink
- Report Inappropriate Content
how to findout the new and repeated mails w.r.to date..?
i have email address and date field, for one date there will be many email address.
here i need to display the count of distinct emails which are new and repeated when we compare with the all old emails.
so for each date i need the distinct count of new emails and old emails, can any body help me with the any work around for this.
my fields are Date and autherisation.
thansk in advance.
Best regards,
V
- Mark as New
- Bookmark
- Subscribe
- Mute
- Subscribe to RSS Feed
- Permalink
- Report Inappropriate Content
Hi Vishal,
See the attached file to see if thats what you want.
Felipe.
- Mark as New
- Bookmark
- Subscribe
- Mute
- Subscribe to RSS Feed
- Permalink
- Report Inappropriate Content
Thanks alot Felip,
your app giving the count of repeated emails for that particular date, i want it to be compared with the old dates and give the count if it is not there in previous dates then it is new else it is repeated.
example :
email,date
a@a.com,01/01/2017
a@a.com,01/01/2017
a@a.com,02/01/2017
a@a.com,02/01/2017
b@a.com,02/01/2017
c@a.com,02/01/2017
c@a.com,03/01/2017
a@a.com,03/01/2017
b@a.com,03/01/2017
a@a.com,03/01/2017
h@a.com,04/01/2017
i@a.com,05/01/2017
j@a.com,07/01/2017
All the mails which are there on 03/01/2017 are repeated when we compare with the old data i.e 01/01/2017 and 02/01/2017 data.
so here i want result should be like
date,count(distinct repeat emails), count(new distinct emails).
03/01/2017 , 3 , 0
Can you please provide the logic. Thanks again.
- Mark as New
- Bookmark
- Subscribe
- Mute
- Subscribe to RSS Feed
- Permalink
- Report Inappropriate Content
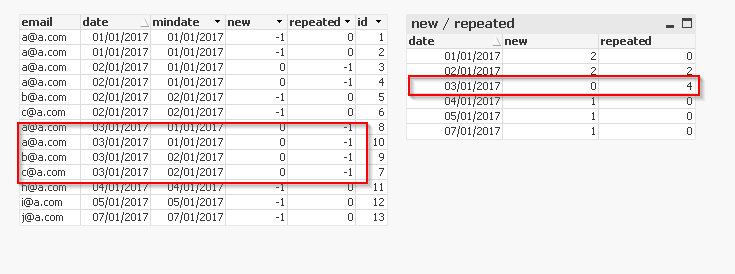
I think you should compare every record with the min date
EmailTable:
Load rowno() as id, * Inline
[
email,date
a@a.com,01/01/2017
a@a.com,01/01/2017
a@a.com,02/01/2017
a@a.com,02/01/2017
b@a.com,02/01/2017
c@a.com,02/01/2017
c@a.com,03/01/2017
a@a.com,03/01/2017
b@a.com,03/01/2017
a@a.com,03/01/2017
h@a.com,04/01/2017
i@a.com,05/01/2017
j@a.com,07/01/2017
];
Left Join (EmailTable) load
email,
Date(min(date)) as mindate
Resident
EmailTable
group by email;
Result:
NoConcatenate LOAD
*,
date <> mindate as repeated,
date = mindate as new
//if(date = mindate, 'new', 'repeated') as type
Resident EmailTable;
DROP Table EmailTable;

- Mark as New
- Bookmark
- Subscribe
- Mute
- Subscribe to RSS Feed
- Permalink
- Report Inappropriate Content
Hi Grossi,
Thanks you very much for the work around, but still facing some issues with my data. counts are not matching.
please find the attached excel with sample data as per my table in db.
account_id is unique to email. where as site id contains multiple account_ids and multiple emails.
one date can contain mutliple site_ids,account_id, and emails.
Now my requirement is like display a chart and tables as below. where are chart gives the distinct counts of new and total emails. and table gives drill down details like below.
PFA to original post. And provide the work around, thanks in advance.
| date | count( distinct new) | count(distinct total) | ||
| 02/01/2017 | 2 | 4 | ||
| date | location_id | Account_id | status(new/repeated) | |
| 02/01/2017 | 1 | 101 | a@a.com | Repeated |
| 02/01/2017 | 2 | 102 | b@a.com | Repeated |
| 02/01/2017 | 3 | 103 | c@a.com | new |
| 02/01/2017 | 4 | 104 | d@a.com | New |