Unlock a world of possibilities! Login now and discover the exclusive benefits awaiting you.
- Qlik Community
- :
- All Forums
- :
- QlikView App Dev
- :
- Re: how to position window title of a Line Chart
- Subscribe to RSS Feed
- Mark Topic as New
- Mark Topic as Read
- Float this Topic for Current User
- Bookmark
- Subscribe
- Mute
- Printer Friendly Page
- Mark as New
- Bookmark
- Subscribe
- Mute
- Subscribe to RSS Feed
- Permalink
- Report Inappropriate Content
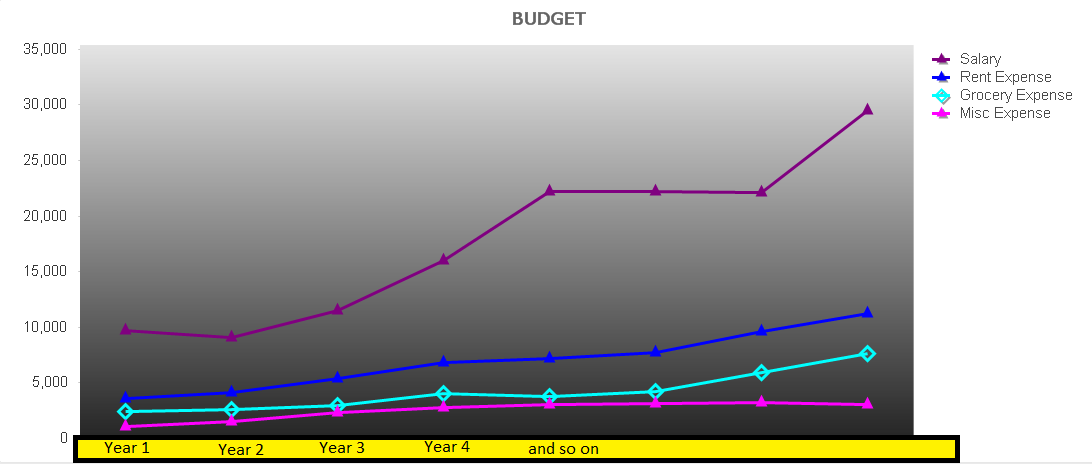
how to position window title of a Line Chart
I am having issues with how the title appears on top of the chart. I want the budget to be at center with respect to plot area, not with respect to whole chart area(which it currently is set to).
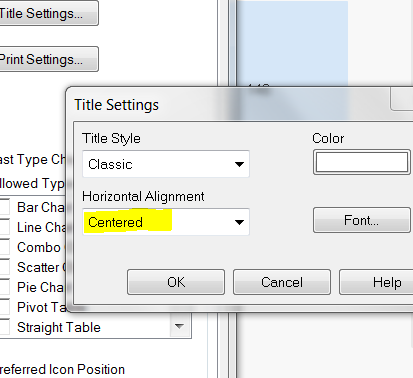
i set title alignment by doing the below:
- « Previous Replies
-
- 1
- 2
- Next Replies »
- Mark as New
- Bookmark
- Subscribe
- Mute
- Subscribe to RSS Feed
- Permalink
- Report Inappropriate Content
I don't think you can control this using the chart settings.
Maybe use text box as wide as the plot area with centered text instead?
(Background can be made transparent)
- Mark as New
- Bookmark
- Subscribe
- Mute
- Subscribe to RSS Feed
- Permalink
- Report Inappropriate Content
If you hit Ctrl+Shift while that chart is selected, red outline boxes will appear around individual 'parts' of your chart. You should be able to move around the position of the title.
- Mark as New
- Bookmark
- Subscribe
- Mute
- Subscribe to RSS Feed
- Permalink
- Report Inappropriate Content
Swuehl,
did you mean put text box on top of chart, make background transp for table box...? for that disable title settings at all for chart?
Regards.
- Mark as New
- Bookmark
- Subscribe
- Mute
- Subscribe to RSS Feed
- Permalink
- Report Inappropriate Content
Right, disable the title in the chart and use a text box instead.
Won't work very well if you need to minimize / maximize / move your line chart. But may work within a dashboard.
- Mark as New
- Bookmark
- Subscribe
- Mute
- Subscribe to RSS Feed
- Permalink
- Report Inappropriate Content
I will try and see if it works.
- Mark as New
- Bookmark
- Subscribe
- Mute
- Subscribe to RSS Feed
- Permalink
- Report Inappropriate Content
or is there script like chr(10) which instead allows space break instead of line break..?
- Mark as New
- Bookmark
- Subscribe
- Mute
- Subscribe to RSS Feed
- Permalink
- Report Inappropriate Content
Could you elaborate further on that? How you want to use a character code to center over the plot area?
- Mark as New
- Bookmark
- Subscribe
- Mute
- Subscribe to RSS Feed
- Permalink
- Report Inappropriate Content
What I meant was just as chr(10) creates another line if we want a row of text to be in the next row, I was wondering if there was similar code that creates spaces. may be &' ' will work
- Mark as New
- Bookmark
- Subscribe
- Mute
- Subscribe to RSS Feed
- Permalink
- Report Inappropriate Content
Yes, you can try to add a number of spaces like
='Title' & Repeat(chr(32),10)
but this might also just be a dirty work around. Available plot area might change depending e.g. on length of your legend values. Nevertheless, I would give it a try.
- « Previous Replies
-
- 1
- 2
- Next Replies »