Unlock a world of possibilities! Login now and discover the exclusive benefits awaiting you.
- Qlik Community
- :
- All Forums
- :
- QlikView App Dev
- :
- how to prepare chart ?
Options
- Subscribe to RSS Feed
- Mark Topic as New
- Mark Topic as Read
- Float this Topic for Current User
- Bookmark
- Subscribe
- Mute
- Printer Friendly Page
Turn on suggestions
Auto-suggest helps you quickly narrow down your search results by suggesting possible matches as you type.
Showing results for
Not applicable
2016-09-26
09:58 AM
- Mark as New
- Bookmark
- Subscribe
- Mute
- Subscribe to RSS Feed
- Permalink
- Report Inappropriate Content
how to prepare chart ?
Hi All,
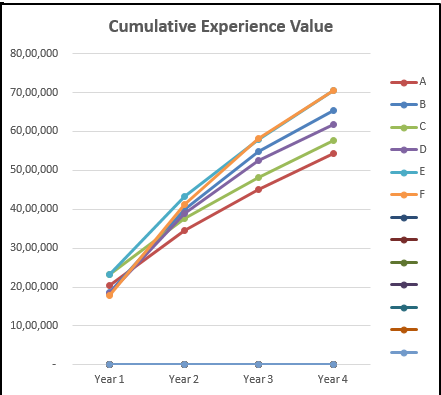
could you please help me to prepare below chart.
SAMPLE DATA IS :
| Year 1 | Year 2 | Year 3 | Year 4 | Year 1 | Year 2 | Year 3 | Year 4 | |
| CUMULATIVE | ORDERS | ORDERS | ORDERS | ORDERS | SALES | SALES | SALES | SALES |
| A | 25,963 | 42,790 | 56,874 | 71,190 | 20,33,639 | 34,64,726 | 45,06,359 | 54,38,038 |
| B | 30,713 | 55,680 | 75,977 | 92,477 | 18,59,421 | 39,82,751 | 54,83,717 | 65,44,741 |
| C | 29,761 | 47,149 | 61,694 | 76,258 | 23,12,625 | 37,64,714 | 48,22,920 | 57,60,811 |
| D | 32,200 | 56,872 | 75,777 | 90,262 | 18,27,132 | 38,87,611 | 52,60,487 | 61,75,222 |
| E | 33,957 | 57,362 | 77,405 | 96,898 | 23,29,230 | 43,15,457 | 57,94,804 | 70,57,418 |
| F | 33,529 | 61,274 | 84,233 | 1,03,231 | 17,76,450 | 41,30,963 | 58,25,161 | 70,44,225 |
362 Views
3 Replies
2016-09-26
12:03 PM
- Mark as New
- Bookmark
- Subscribe
- Mute
- Subscribe to RSS Feed
- Permalink
- Report Inappropriate Content
Would you provide the Excel?
Best Anil, When applicable please mark the correct/appropriate replies as "solution" (you can mark up to 3 "solutions". Please LIKE threads if the provided solution is helpful
305 Views
MVP
2016-09-26
12:26 PM
- Mark as New
- Bookmark
- Subscribe
- Mute
- Subscribe to RSS Feed
- Permalink
- Report Inappropriate Content
Sales and Orders are on the same chart? Wouldn't that be too confusing?
305 Views
Specialist III
2016-09-26
01:26 PM
- Mark as New
- Bookmark
- Subscribe
- Mute
- Subscribe to RSS Feed
- Permalink
- Report Inappropriate Content
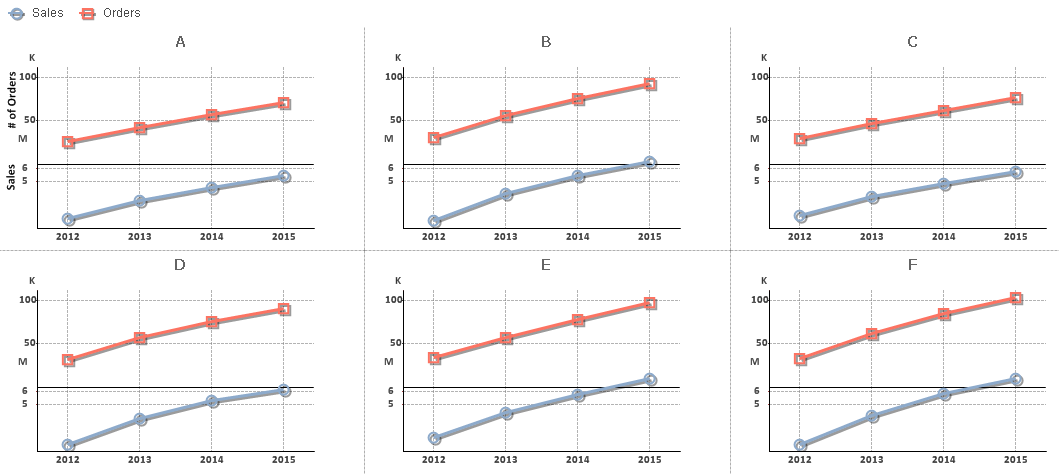
you might try using a trellis chart for multiple products but you have to either split axis or present Orders and Sales separately as their scale varies. Given below are snapshot of both.
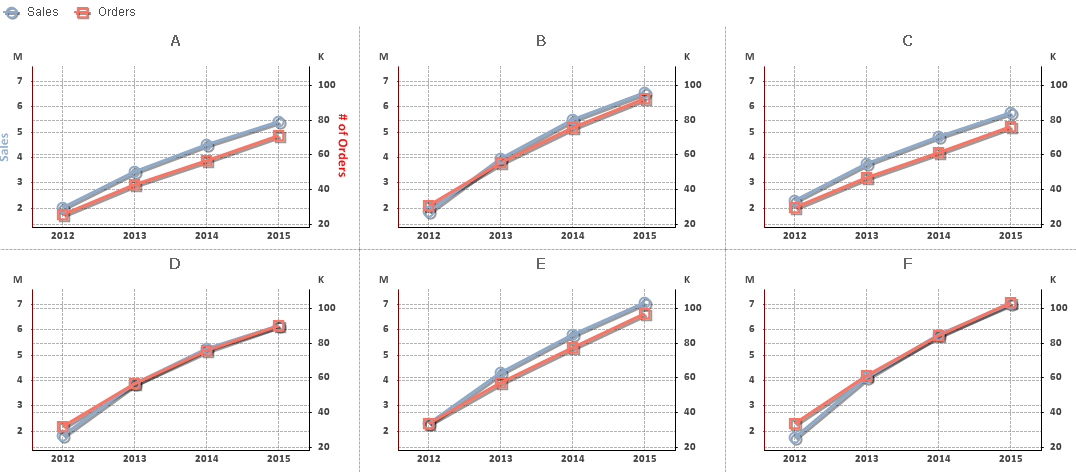
with Split Axis:
305 Views