Unlock a world of possibilities! Login now and discover the exclusive benefits awaiting you.
- Qlik Community
- :
- All Forums
- :
- QlikView App Dev
- :
- Re: ignore the dimension
- Subscribe to RSS Feed
- Mark Topic as New
- Mark Topic as Read
- Float this Topic for Current User
- Bookmark
- Subscribe
- Mute
- Printer Friendly Page
- Mark as New
- Bookmark
- Subscribe
- Mute
- Subscribe to RSS Feed
- Permalink
- Report Inappropriate Content
ignore the dimension
Help, people are kind. Sorry for my english (translator)![]()
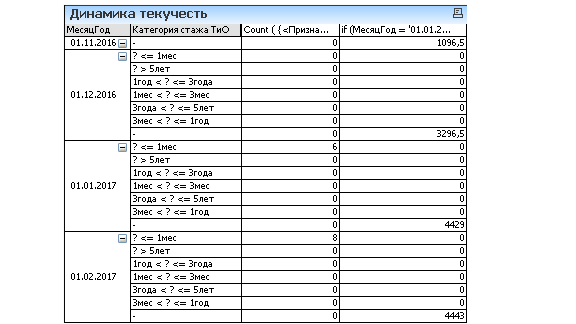
How can I make the numbers in the second column in all dimensions (measurements from another table, so, accordingly, he does not count on them). We can say that he ignored the second dimension.
The first measurement of the MonthYear, second - Experience

should work out like that. is this real?
- Mark as New
- Bookmark
- Subscribe
- Mute
- Subscribe to RSS Feed
- Permalink
- Report Inappropriate Content
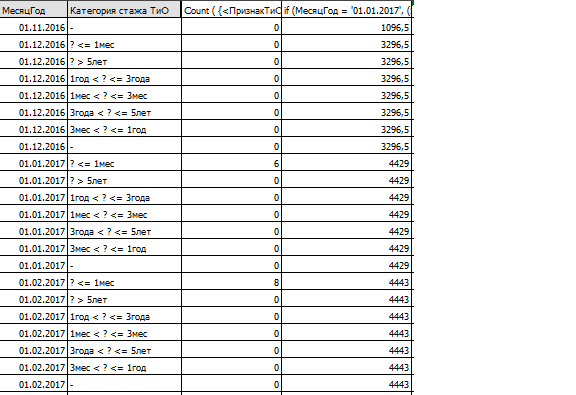
at the moment, like this:
Sum( {$<bias = {'0'}, Experience = >} [Active number])
- Mark as New
- Bookmark
- Subscribe
- Mute
- Subscribe to RSS Feed
- Permalink
- Report Inappropriate Content
strictly do not judge, please, this is my first experience)![]()
how could I cut all the data
- Mark as New
- Bookmark
- Subscribe
- Mute
- Subscribe to RSS Feed
- Permalink
- Report Inappropriate Content
try this
Sum(total <МесяцГод>{$<?Смещение = {'0'} , [Категория стажа ТиО] = >}[Активная численность])
- Mark as New
- Bookmark
- Subscribe
- Mute
- Subscribe to RSS Feed
- Permalink
- Report Inappropriate Content
Hooray, this is what I need!![]()
thank you very much! You are a genius!![]()
- Mark as New
- Bookmark
- Subscribe
- Mute
- Subscribe to RSS Feed
- Permalink
- Report Inappropriate Content
Glad that it was helpful ![]()
- Mark as New
- Bookmark
- Subscribe
- Mute
- Subscribe to RSS Feed
- Permalink
- Report Inappropriate Content
The working expression:
Sum(TOTAL <МесяцГод> {$<?Смещение = {'0'} , [Категория стажа ТиО] = >}[Активная численность])
Edit: I am late.![]()
- Mark as New
- Bookmark
- Subscribe
- Mute
- Subscribe to RSS Feed
- Permalink
- Report Inappropriate Content
tresesco let us take advantage sometime ![]()
- Mark as New
- Bookmark
- Subscribe
- Mute
- Subscribe to RSS Feed
- Permalink
- Report Inappropriate Content
When such great helping people like you are around, the main advantages lie with the OP though.
- Mark as New
- Bookmark
- Subscribe
- Mute
- Subscribe to RSS Feed
- Permalink
- Report Inappropriate Content
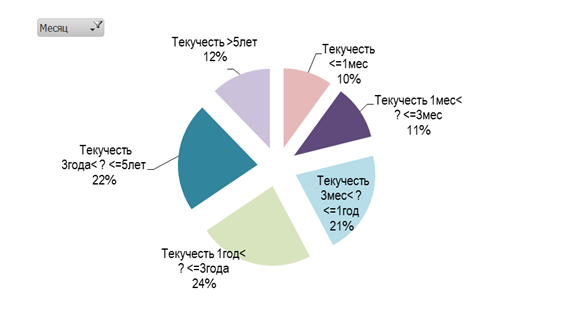
And then one more question can be asked, how to transform all this beauty into a circular diagram, the measurement of the experience?
Initially, the picture was for the last month, and when you select a filter - the selected date
sorry for the arrogance, I just thought it would be easier![]()

ADD: when I put a filter on the date everything is considered, but when there is no filter, it does not count, it can be done so that this chart has always been calculated for the maximum MonthYear?
- Mark as New
- Bookmark
- Subscribe
- Mute
- Subscribe to RSS Feed
- Permalink
- Report Inappropriate Content
True. But when a legend like you already replied to the OP, it is 1 % chance that I would get correct answer.