Unlock a world of possibilities! Login now and discover the exclusive benefits awaiting you.
- Qlik Community
- :
- All Forums
- :
- QlikView App Dev
- :
- legend in a bar chart
- Subscribe to RSS Feed
- Mark Topic as New
- Mark Topic as Read
- Float this Topic for Current User
- Bookmark
- Subscribe
- Mute
- Printer Friendly Page
- Mark as New
- Bookmark
- Subscribe
- Mute
- Subscribe to RSS Feed
- Permalink
- Report Inappropriate Content
legend in a bar chart
Hi,
It is possible to show numbers in legend on a pie chart - see option below.
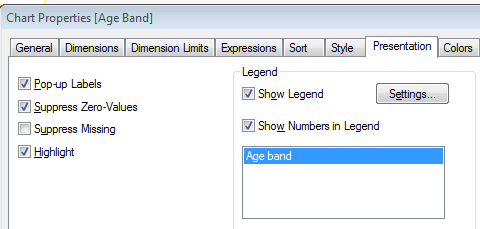
However, this option does not seem to be possible on a bar chart (same tick box isn't there). Is it possible to add this on?
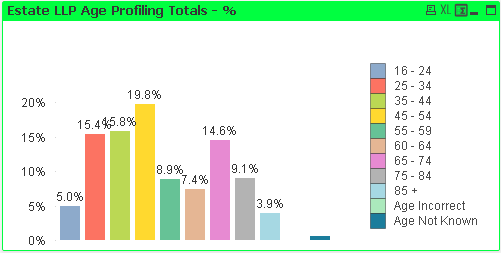
You will see the cahrt we have - where the legend is instead of 16-24, 25-35 we ideally wnat the colours to show but then show the numbers (e.g 50, 100 etc). Is this possible?
Chris
- Tags:
- new_to_qlikview
- Mark as New
- Bookmark
- Subscribe
- Mute
- Subscribe to RSS Feed
- Permalink
- Report Inappropriate Content
Great - which tab is custom format cell on?
- Mark as New
- Bookmark
- Subscribe
- Mute
- Subscribe to RSS Feed
- Permalink
- Report Inappropriate Content
which the names u want to hide select dat filed names...and do custm format
- Mark as New
- Bookmark
- Subscribe
- Mute
- Subscribe to RSS Feed
- Permalink
- Report Inappropriate Content
Yuo mean to say, You dont want to show Age Band, Is It??
- Mark as New
- Bookmark
- Subscribe
- Mute
- Subscribe to RSS Feed
- Permalink
- Report Inappropriate Content
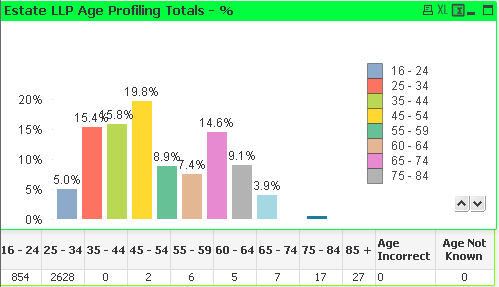
This is the chart - we ideally done want to show the straight table column below chart with age bands on. We can just hide it behind chart but wondering if there was an option to just remove the column.
We also want to remove the legend but when you untick this they then go on the x axis - hence the desire to hide in straight table below.
Is there any ability to widen width of bars without having to extend width of box.
- Mark as New
- Bookmark
- Subscribe
- Mute
- Subscribe to RSS Feed
- Permalink
- Report Inappropriate Content
write a if condition like if(column_name="Age Incorrect" or column_name="Age Not Known",null(), column_name)
Hope this helps you
- Mark as New
- Bookmark
- Subscribe
- Mute
- Subscribe to RSS Feed
- Permalink
- Report Inappropriate Content
Hi,
Thanks for this. Where do I add this on the properties?
Chris
- Mark as New
- Bookmark
- Subscribe
- Mute
- Subscribe to RSS Feed
- Permalink
- Report Inappropriate Content
I think you build the interval in the script rite? and you have used the same column in the front end
implement this expression in the dimension part where the interval column is used
if your 16 - 24 , 25 - 34 etc are stored in the column name A than use this condition in the dimension
- Mark as New
- Bookmark
- Subscribe
- Mute
- Subscribe to RSS Feed
- Permalink
- Report Inappropriate Content
Hi Chris,
May be you can try something like as shown in the attached image.
- Mark as New
- Bookmark
- Subscribe
- Mute
- Subscribe to RSS Feed
- Permalink
- Report Inappropriate Content
That would be great but how to you get the legend to transpose along the bottom?
- Mark as New
- Bookmark
- Subscribe
- Mute
- Subscribe to RSS Feed
- Permalink
- Report Inappropriate Content
Press the ctrl and shift key and drag the legend into bottom
and just adjust the legend box size