Unlock a world of possibilities! Login now and discover the exclusive benefits awaiting you.
- Qlik Community
- :
- All Forums
- :
- QlikView App Dev
- :
- limit rows in pivot table
- Subscribe to RSS Feed
- Mark Topic as New
- Mark Topic as Read
- Float this Topic for Current User
- Bookmark
- Subscribe
- Mute
- Printer Friendly Page
- Mark as New
- Bookmark
- Subscribe
- Mute
- Subscribe to RSS Feed
- Permalink
- Report Inappropriate Content
limit rows in pivot table
Hi All,
I want to limit the no. of rows in the pivot table.
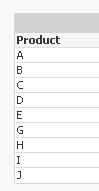
Currently you can see there are 9 products. I want to show 4 products in each pivot table, ie. in first table i want to show A to D Product, in 2nd pivot table E to H Products details and in final table the remaining Product ie, J.
Please help
- « Previous Replies
-
- 1
- 2
- Next Replies »
Accepted Solutions
- Mark as New
- Bookmark
- Subscribe
- Mute
- Subscribe to RSS Feed
- Permalink
- Report Inappropriate Content
- Mark as New
- Bookmark
- Subscribe
- Mute
- Subscribe to RSS Feed
- Permalink
- Report Inappropriate Content
You can do this with set analysis .
Example for Table 1
sum({<Product={A,B,C,D}>}Margin)/sum( {<Product={A,B,C,D}>} Sales)
If you are new to set analysis, check to this article https://community.qlik.com/blogs/qlikviewdesignblog/2015/02/16/set-analysis for an introduction.
Regards,
Pablo
- Mark as New
- Bookmark
- Subscribe
- Mute
- Subscribe to RSS Feed
- Permalink
- Report Inappropriate Content
Thanks for your reply Pablo.
I real data has thousand's of products. so i think its not eazy to handle using SA.
- Mark as New
- Bookmark
- Subscribe
- Mute
- Subscribe to RSS Feed
- Permalink
- Report Inappropriate Content
Hi Suraj,
try using If condition in calculated dimension in that way we can limit the data.
Many Thanks
Karthik
- Mark as New
- Bookmark
- Subscribe
- Mute
- Subscribe to RSS Feed
- Permalink
- Report Inappropriate Content
is it possible to write the calculated dimension using a range. ie assigning the products to numbers and those numbers we put in the cal dimension.
Could you please help with with the expression.
- Mark as New
- Bookmark
- Subscribe
- Mute
- Subscribe to RSS Feed
- Permalink
- Report Inappropriate Content
So you need to define the range scope for each table.
The range scope will be based on product attribute or sales ammount ?
- Mark as New
- Bookmark
- Subscribe
- Mute
- Subscribe to RSS Feed
- Permalink
- Report Inappropriate Content
Like the attached
- Mark as New
- Bookmark
- Subscribe
- Mute
- Subscribe to RSS Feed
- Permalink
- Report Inappropriate Content
i want to have range based on product name, as in my example.
could you please help me with the expression(calculated dimension)
- Mark as New
- Bookmark
- Subscribe
- Mute
- Subscribe to RSS Feed
- Permalink
- Report Inappropriate Content
Thank you so much for the expression/solution.
I have a final query.
The below set analayai is to filter out the products with no sales. Am i right?
{<Product = {"=Sum(Margin)/Sum(Sales) > 0"}>}
If yes, then i see all my products has sales i hope i can simplify the expression like below, do you agree?
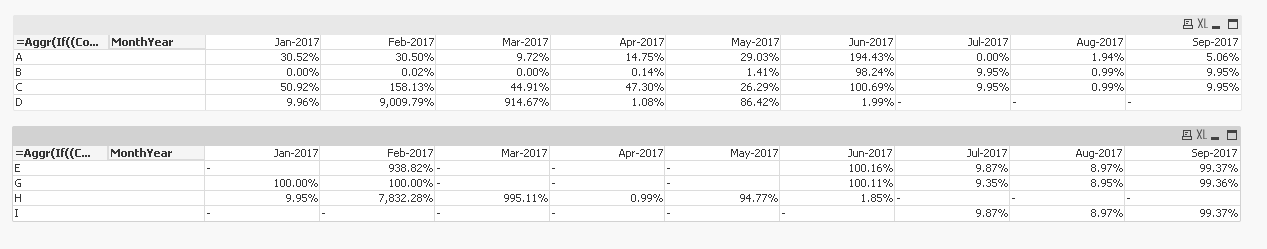
=Aggr(
If((Count(DISTINCT Total Product) - Rank(Only(Product))+1) <= 4,
Product),
Product)
- Mark as New
- Bookmark
- Subscribe
- Mute
- Subscribe to RSS Feed
- Permalink
- Report Inappropriate Content
Yes that is what it was meant to do... because f didn't have any margin or sales and was not showing up on chart 2.... but if everything in your real data have margin and sales... you can remove the set analysis
- « Previous Replies
-
- 1
- 2
- Next Replies »