Unlock a world of possibilities! Login now and discover the exclusive benefits awaiting you.
- Qlik Community
- :
- All Forums
- :
- QlikView App Dev
- :
- Re: n00b: Count & Sum based on a list of values wi...
- Subscribe to RSS Feed
- Mark Topic as New
- Mark Topic as Read
- Float this Topic for Current User
- Bookmark
- Subscribe
- Mute
- Printer Friendly Page
- Mark as New
- Bookmark
- Subscribe
- Mute
- Subscribe to RSS Feed
- Permalink
- Report Inappropriate Content
n00b: Count & Sum based on a list of values with conditions
Hi
At first it appeared that I could ask my question in Dutch but perhaps not, so better twice.
I have loaded a long list of values: duration of phonecalls (in secs).
Duration:
12
45
458
150
41
900
1845
427
I want to build a bar chart that will show me the total of calls that 1) 'lasted less than 300 secs', a total of calls 2) that took 'between 300 and 600 seconds' and 3) one for calls 'longer than 600 secs'.
I assume it will be piece of cake, but please spare me... I am still a n00b to QV...
Thanking you in advance for your reaction(s). 🙂
Alexander
Hallo, het lijkt dat ik hier in het Nederlands een vraag kan stellen, dus doe ik het graag.
Ik heb een lange lijst met willekeurige waarden ingelezen: de duur van telefoongesprekken in seconden.
Nou wil ik een bar graph maken, waarbij ik ergens het aantal gesprekken optel dat minder dat 300 seconden duurde, tussen de 300 en 599 seconden en langer dan 600. Ben al een tijd aan het knoeien geweest maar kon ook via Google geen goede voorbeelden vinden.
Dank voor de gewaardeerde reactie(s) want het zal een appeltje-eitje zijn vermoed ik.
Alexander
Accepted Solutions
- Mark as New
- Bookmark
- Subscribe
- Mute
- Subscribe to RSS Feed
- Permalink
- Report Inappropriate Content
You have wrong Design, use on design group option, and use one without 3d.
- Mark as New
- Bookmark
- Subscribe
- Mute
- Subscribe to RSS Feed
- Permalink
- Report Inappropriate Content
Hope this helps.
count({<Duration={'>=300<=600'}>}CallID)
count({<Duration={'<300'}>}CallID)
count({<Duration={'>600'}>}CallID)
You can find this kind of expressions under Set Analysis, her in the forum or in the help.
- Mark as New
- Bookmark
- Subscribe
- Mute
- Subscribe to RSS Feed
- Permalink
- Report Inappropriate Content
Hi,
attached..
HTH
André Gomes
- Mark as New
- Bookmark
- Subscribe
- Mute
- Subscribe to RSS Feed
- Permalink
- Report Inappropriate Content
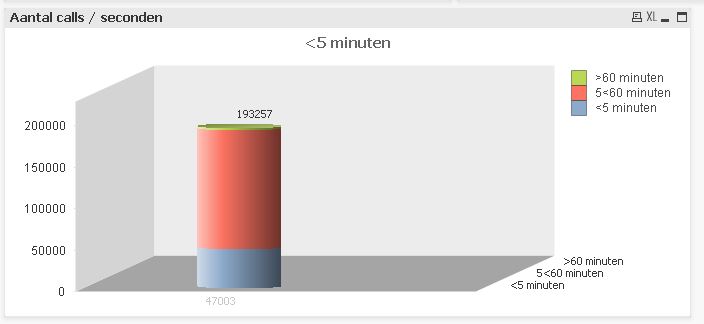
Hi Jonas,
Thanks for your reaction. I have placed your three expressions in three expressions and did manage to get something visible, but... not completely right. I think since I haven't defined a dimension (what do I need... actually ... nothing: just want to have these three bars next to each other with the total number of phonecalls that meet the requirements.) The total on top 193257 would meet the criterium for 5<60 minutes and 47003 for <5... Somehow it appeared in 3-d. 😕
- Mark as New
- Bookmark
- Subscribe
- Mute
- Subscribe to RSS Feed
- Permalink
- Report Inappropriate Content
Hi André
Thank you for your efforts. Unfortunately I have to 'sell' the dashboard to the management first to be able to get funds to buy a full license. I am still getting to know QV and therefore cannot open your qvw... I do appreciate the efforts you put into it and perhaps I can get myself a license next week and will be able to dig into it if a solution does not become available.
Alex
- Mark as New
- Bookmark
- Subscribe
- Mute
- Subscribe to RSS Feed
- Permalink
- Report Inappropriate Content
You have wrong Design, use on design group option, and use one without 3d.
- Mark as New
- Bookmark
- Subscribe
- Mute
- Subscribe to RSS Feed
- Permalink
- Report Inappropriate Content
another solution could be
RESULT
dim durtype
exp count(dur)

SCRIPT
Duration:
load
dur,
if(dur <300, dual('lasted less than 300 secs', 1),
if(dur >=300 and dur <=600, dual('between 300 and 600 seconds', 2),
if(dur >600, dual('longer than 600 secs', 3)
))) as durtype;
load * inline [
dur
12
45
458
150
41
900
1845
427
];
- Mark as New
- Bookmark
- Subscribe
- Mute
- Subscribe to RSS Feed
- Permalink
- Report Inappropriate Content
I have been working with QV all day. Excel crashed. I rebooted the machine and: Voila. This time it worked like a charm although I am sure I tried the same earlier.. Thanks!
Topic can be closed!
I Call it a day after 14 hours 🙂
- Mark as New
- Bookmark
- Subscribe
- Mute
- Subscribe to RSS Feed
- Permalink
- Report Inappropriate Content
That is something I will try tomorrow. I do see a function for that as well!
Thanks Massimo!