Unlock a world of possibilities! Login now and discover the exclusive benefits awaiting you.
Announcements
Qlik Open Lakehouse is Now Generally Available! Discover the key highlights and partner resources here.
- Qlik Community
- :
- All Forums
- :
- QlikView App Dev
- :
- "Trendline Linear" Reference line 10% help
Options
- Subscribe to RSS Feed
- Mark Topic as New
- Mark Topic as Read
- Float this Topic for Current User
- Bookmark
- Subscribe
- Mute
- Printer Friendly Page
Turn on suggestions
Auto-suggest helps you quickly narrow down your search results by suggesting possible matches as you type.
Showing results for
Anonymous
Not applicable
2018-04-23
09:29 AM
- Mark as New
- Bookmark
- Subscribe
- Mute
- Subscribe to RSS Feed
- Permalink
- Report Inappropriate Content
"Trendline Linear" Reference line 10% help
Hi,
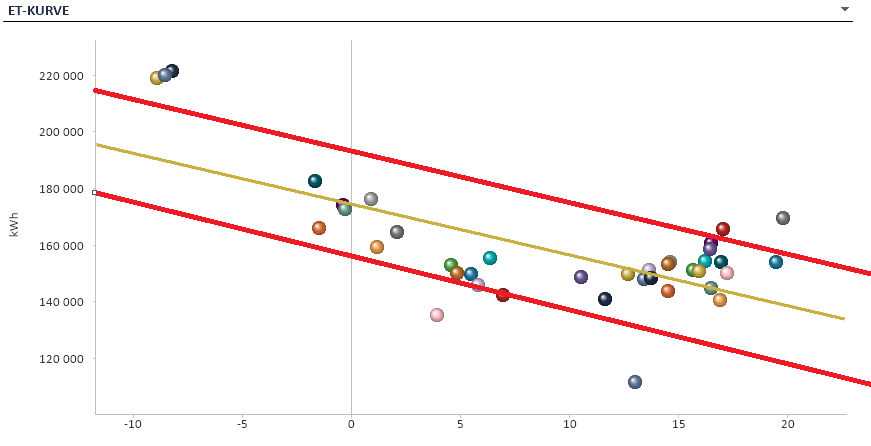
What is the expression to create two linear trendlines +/- 10%?
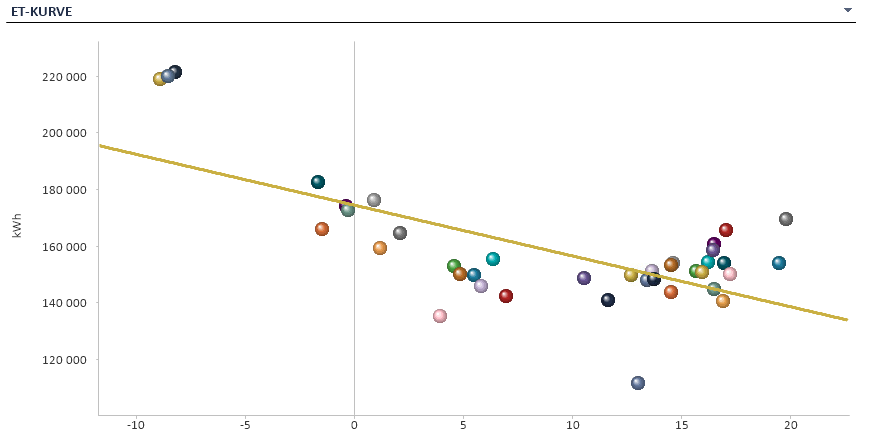
X: AVG(Temp)
Y: Sum(kWh)
I want the chart to look like this:
1,341 Views
3 Replies
MVP
2018-04-23
09:37 AM
- Mark as New
- Bookmark
- Subscribe
- Mute
- Subscribe to RSS Feed
- Permalink
- Report Inappropriate Content
May be use Linest function to create a linear line and multiple it with 1.10 and 0.90 to get the two other lines
Anonymous
Not applicable
2018-04-23
09:51 AM
Author
- Mark as New
- Bookmark
- Subscribe
- Mute
- Subscribe to RSS Feed
- Permalink
- Report Inappropriate Content
Thanks for reply.
I have tried, but i dont understand how to use that function in my application...
1,236 Views
Anonymous
Not applicable
2018-04-23
09:52 AM
Author
- Mark as New
- Bookmark
- Subscribe
- Mute
- Subscribe to RSS Feed
- Permalink
- Report Inappropriate Content
Y: Sum(kWh)
X: AVG(Temp)
Dimension is week.
1,236 Views