Unlock a world of possibilities! Login now and discover the exclusive benefits awaiting you.
- Qlik Community
- :
- All Forums
- :
- QlikView App Dev
- :
- rangesum problem...?
- Subscribe to RSS Feed
- Mark Topic as New
- Mark Topic as Read
- Float this Topic for Current User
- Bookmark
- Subscribe
- Mute
- Printer Friendly Page
- Mark as New
- Bookmark
- Subscribe
- Mute
- Subscribe to RSS Feed
- Permalink
- Report Inappropriate Content
rangesum problem...?
I have the following data:
Year Month Sales
| 2013 | 1 | 1000 |
| 2013 | 2 | 2000 |
| 2013 | 3 | 3000 |
| 2013 | 4 | 4000 |
| 2013 | 5 | 5000 |
| 2013 | 6 | 6000 |
| 2013 | 7 | 7000 |
| 2013 | 8 | 8000 |
| 2013 | 9 | 9000 |
| 2013 | 10 | 10000 |
| 2013 | 11 | 11000 |
| 2013 | 12 | 12000 |
I need to select a month and the graph has to show the sales of that month + previous month
example:
if I choose month = 4
The graph should show: 7000
is that range sum or set-analysis?
- Mark as New
- Bookmark
- Subscribe
- Mute
- Subscribe to RSS Feed
- Permalink
- Report Inappropriate Content
hi
try this
sum({$<Month={'>=$(=max(Month-1))<=$(=max(Month+1))'}>}Sales)
- Mark as New
- Bookmark
- Subscribe
- Mute
- Subscribe to RSS Feed
- Permalink
- Report Inappropriate Content
You can do it both ways. If you have doubt, prepare a sample app and share. It would be easier to help you there. See how to prepare sample for uploading
- Mark as New
- Bookmark
- Subscribe
- Mute
- Subscribe to RSS Feed
- Permalink
- Report Inappropriate Content
hi
sorry some mistakes in my above post
try this
=sum({$<Month={'>=$(=max(Month-1))<=$(=max(Month))'}>}Sales)
- Mark as New
- Bookmark
- Subscribe
- Mute
- Subscribe to RSS Feed
- Permalink
- Report Inappropriate Content
hi
see attached file
- Mark as New
- Bookmark
- Subscribe
- Mute
- Subscribe to RSS Feed
- Permalink
- Report Inappropriate Content
Hi,
Use this set analysis: =Sum({<Month = {">=$(=Max(Month)-1)<=$(=Max(Month))"} >} Sales)
Regards,
Sokkorn
- Mark as New
- Bookmark
- Subscribe
- Mute
- Subscribe to RSS Feed
- Permalink
- Report Inappropriate Content
Try this
Sum({<Month = {'>=$(=Max(Month)-1)<=$(=Max(Month))'} >} Sales)
- Mark as New
- Bookmark
- Subscribe
- Mute
- Subscribe to RSS Feed
- Permalink
- Report Inappropriate Content
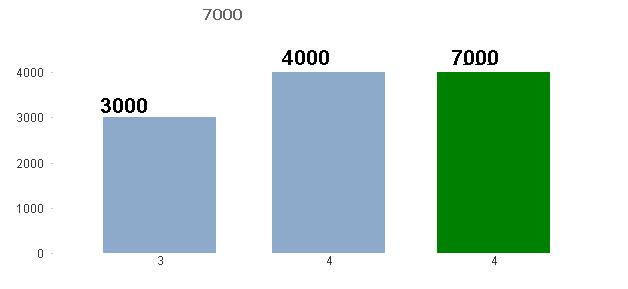
This one works! but in separate bars in the graph...
I need that the graph show the sum like if I choose month 4...the chart in one bar must show 7000...(4000+3000):
thanks
- Mark as New
- Bookmark
- Subscribe
- Mute
- Subscribe to RSS Feed
- Permalink
- Report Inappropriate Content
Good Example, but I need like the green bar in the picture..
how could I do that?