Unlock a world of possibilities! Login now and discover the exclusive benefits awaiting you.
- Qlik Community
- :
- All Forums
- :
- QlikView App Dev
- :
- show numbers in %
- Subscribe to RSS Feed
- Mark Topic as New
- Mark Topic as Read
- Float this Topic for Current User
- Bookmark
- Subscribe
- Mute
- Printer Friendly Page
- Mark as New
- Bookmark
- Subscribe
- Mute
- Subscribe to RSS Feed
- Permalink
- Report Inappropriate Content
show numbers in %
Hi,
I have data in the below format. when i try to show the change column in %, i not getting the expected result.
| Header 1 | Header 2 | Header 3 | Header 4 |
|---|---|---|---|
| A | 56% | 60% | (4%) |
| B | 55% | 56% | (1%) |
| C | 33% | 32% | 1% |
the result should be the one shown i the table but i am getting 0% for both 2nd and 3rd row. how to fix this. I need to show the difference of 2nd and 3rd column in %.
Regards,
Viresh
- Mark as New
- Bookmark
- Subscribe
- Mute
- Subscribe to RSS Feed
- Permalink
- Report Inappropriate Content
What is the expression used here? and what kind of formatting is used?
- Mark as New
- Bookmark
- Subscribe
- Mute
- Subscribe to RSS Feed
- Permalink
- Report Inappropriate Content
I am exporting the data from excel and it is shown in % in excel as well. In expression, i am just using the column names
- Mark as New
- Bookmark
- Subscribe
- Mute
- Subscribe to RSS Feed
- Permalink
- Report Inappropriate Content
can you upload an example please? What you ask if far too vague!
Andy
- Mark as New
- Bookmark
- Subscribe
- Mute
- Subscribe to RSS Feed
- Permalink
- Report Inappropriate Content
I am still not sure what is going on. Would you be able to share a sample or screenshots?
- Mark as New
- Bookmark
- Subscribe
- Mute
- Subscribe to RSS Feed
- Permalink
- Report Inappropriate Content
Viresh, Try to put expression is Relative and they Go to Number tab and then Choose that expression Integer and Check the %
Or If you have calc expressions please share sample App
- Mark as New
- Bookmark
- Subscribe
- Mute
- Subscribe to RSS Feed
- Permalink
- Report Inappropriate Content
Hey, i tried it but getting different numbers. attached is the sample data and qvw.
Thanks
- Mark as New
- Bookmark
- Subscribe
- Mute
- Subscribe to RSS Feed
- Permalink
- Report Inappropriate Content
Viresh, in the number tab select the "Change" field and set it to Fixed- 1 decimals. See screenshot.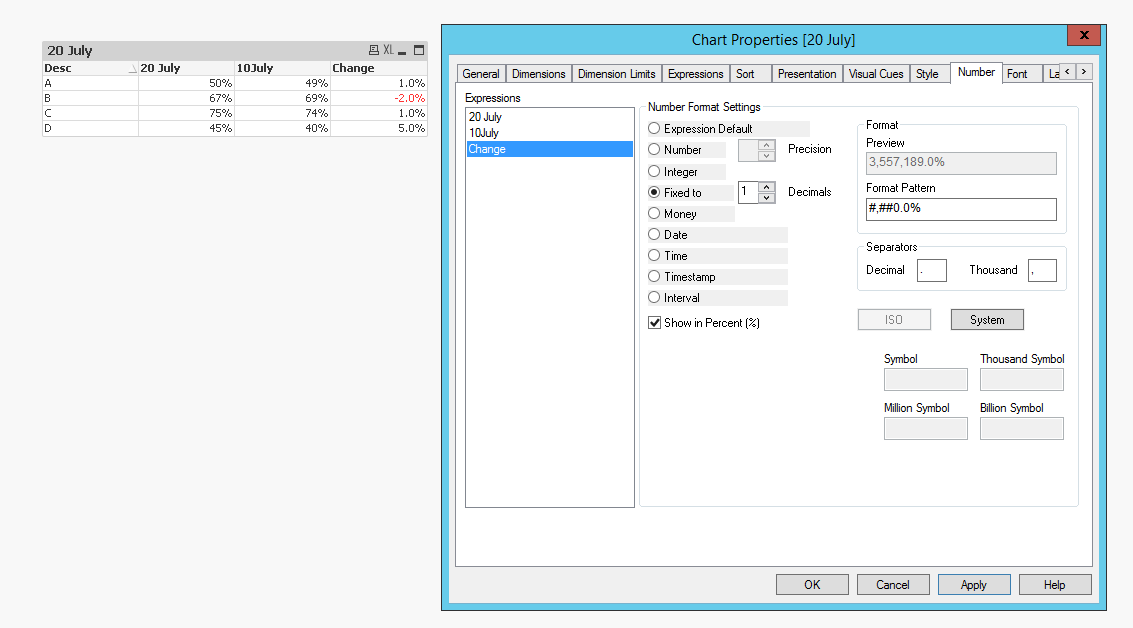
Regards,
Carlos
- Mark as New
- Bookmark
- Subscribe
- Mute
- Subscribe to RSS Feed
- Permalink
- Report Inappropriate Content
Hi Carlos,
Thanks but i don't want show the decimal places .
When i try to show the negative numbers in brackets still getting 0.0% even after providing single decimal place.
Regards,
Vires