Unlock a world of possibilities! Login now and discover the exclusive benefits awaiting you.
- Qlik Community
- :
- All Forums
- :
- QlikView App Dev
- :
- show sum of previous 3 months in month column
- Subscribe to RSS Feed
- Mark Topic as New
- Mark Topic as Read
- Float this Topic for Current User
- Bookmark
- Subscribe
- Mute
- Printer Friendly Page
- Mark as New
- Bookmark
- Subscribe
- Mute
- Subscribe to RSS Feed
- Permalink
- Report Inappropriate Content
show sum of previous 3 months in month column
I dont know why I cant get this working and think I must be missing something really simple here and having a bad day!
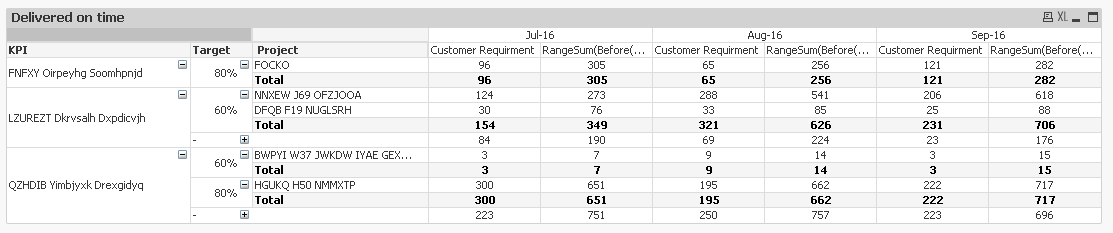
Basically I am plotting a month year dimension in a pivot table column and in each month year showing, I want to show the current month figure as one expression and and the last 3 months cumulative figure as another.
I have tried rangesum but of course, it wont count those months not showing in the chart when a selection is made.
I have also used addmonths in my expression but cant seem to get the correct figure.
Please see attached - I have put a book mark to select the last 3 months.
Sept - 16 is fine as its previous 2 months are still on the chart.
I am against the clock which always seems to make troubleshooting these things even harder!!
Accepted Solutions
- Mark as New
- Bookmark
- Subscribe
- Mute
- Subscribe to RSS Feed
- Permalink
- Report Inappropriate Content
Try this:
RangeSum(Before(Count({<Snapshots.MonthYear>} DISTINCT Snapshots.COVLOOKUP),0,3)) * Avg(1)
- Mark as New
- Bookmark
- Subscribe
- Mute
- Subscribe to RSS Feed
- Permalink
- Report Inappropriate Content
Try this:
RangeSum(Before(Count({<Snapshots.MonthYear>} DISTINCT Snapshots.COVLOOKUP),0,3)) * Avg(1)
- Mark as New
- Bookmark
- Subscribe
- Mute
- Subscribe to RSS Feed
- Permalink
- Report Inappropriate Content
Sunny.
Thanks - this seems to work a treat. I have never used this * Avg(1) before so this is new to me 🙂
In the app - do you know why if I enable the expressions that have no labels on them - the chart ignores the MonthYear selections?
Tracy
- Mark as New
- Bookmark
- Subscribe
- Mute
- Subscribe to RSS Feed
- Permalink
- Report Inappropriate Content
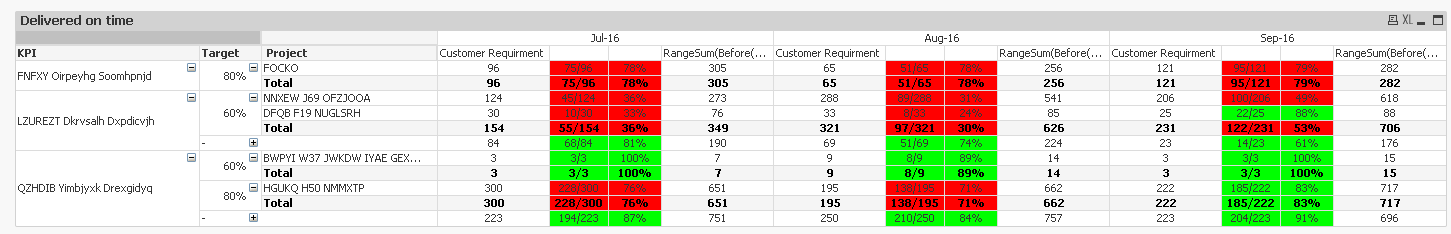
Because of this expression
=($(eDeliveredOnTime)) & '/' & $(eCustomerRequirement)
The part in the red is causing issue. You can try like this:
=If($(eDeliveredOnTime) <> 0, ($(eDeliveredOnTime)) & '/' & $(eCustomerRequirement))
- Mark as New
- Bookmark
- Subscribe
- Mute
- Subscribe to RSS Feed
- Permalink
- Report Inappropriate Content
Thanks Sunny - I had settled on that if statement as a workaround so nice to see you confirm it!
I really appreciate your swift help in this, You are a star.