Unlock a world of possibilities! Login now and discover the exclusive benefits awaiting you.
- Qlik Community
- :
- All Forums
- :
- QlikView App Dev
- :
- Re: show the last data in the month
- Subscribe to RSS Feed
- Mark Topic as New
- Mark Topic as Read
- Float this Topic for Current User
- Bookmark
- Subscribe
- Mute
- Printer Friendly Page
- Mark as New
- Bookmark
- Subscribe
- Mute
- Subscribe to RSS Feed
- Permalink
- Report Inappropriate Content
show the last data in the month
Hello,
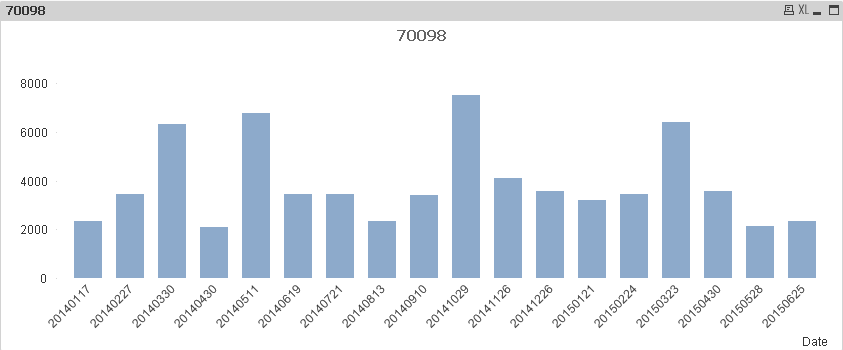
I'm making a chart with this data
| date | sales |
| 07/01/2014 | 1000 |
| 17/01/2014 | 2332 |
| 17/02/2014 | 1100 |
| 27/02/2014 | 3464 |
| 20/03/2014 | 1120 |
| 30/03/2014 | 6344 |
| 15/04/2014 | 4333 |
| 30/04/2014 | 2100 |
| 01/05/2014 | 1132 |
| 11/05/2014 | 6789 |
| 09/06/2014 | 1456 |
| 19/06/2014 | 3456 |
| 11/07/2014 | 3654 |
| 21/07/2014 | 3462 |
| 03/08/2014 | 1569 |
| 13/08/2014 | 2356 |
| 08/09/2014 | 5482 |
| 10/09/2014 | 3421 |
| 22/10/2014 | 6652 |
| 29/10/2014 | 7532 |
| 01/11/2014 | 8754 |
| 26/11/2014 | 4125 |
| 16/12/2014 | 6325 |
| 26/12/2014 | 3564 |
| 11/01/2015 | 9856 |
| 21/01/2015 | 3222 |
| 14/02/2015 | 5432 |
| 24/02/2015 | 3464 |
| 13/03/2015 | 4654 |
| 23/03/2015 | 6422 |
| 22/04/2015 | 5489 |
| 30/04/2015 | 3554 |
| 08/05/2015 | 3235 |
| 28/05/2015 | 2145 |
| 05/06/2015 | 5236 |
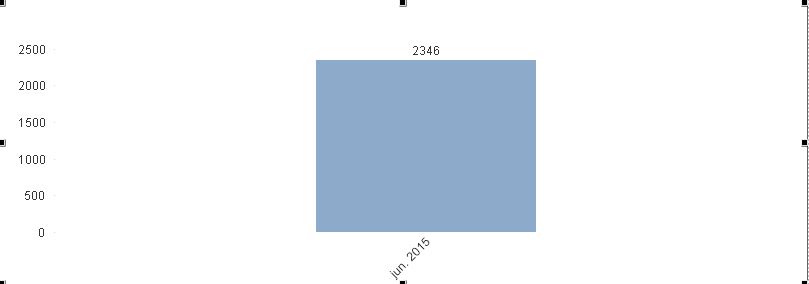
| 25/06/2015 | 2346 |
in the scrypt I get year, month and week, this is ok.
Now I want to show in a bar chart (with month as the dimensión), the sales of the last week of the month. For example with the data before:
2014
Jan 2332
Feb 3464
Mar 6344
Aprl 2100
May 6789
Jun 3456
etc
How can I do it?
thanks very much!!
- Tags:
- chart
- new_to_qlikview
Accepted Solutions
- Mark as New
- Bookmark
- Subscribe
- Mute
- Subscribe to RSS Feed
- Permalink
- Report Inappropriate Content
Hi!
You could also do this in script. Make little table holding only necessary values. You can then use them as is or for example map those to fact-table.
Example:
I made excel-file from your example data for easy load.
Data:
LOAD date as Date,
sales as Sales,
Year(date)&Num(Month(date),'00') as MonthNum
FROM
(ooxml, embedded labels, table is Sheet1);
tmp1:
Load
Max(Date) as MaxDate,
MonthNum as M
Resident Data
Group By MonthNum;
Left Join
Load
Num(Date) as MaxDate,
Sales as MaxSales
Resident Data;
Now you can easily make chart like this:
Br,
Miikka
Climber Finland
- Mark as New
- Bookmark
- Subscribe
- Mute
- Subscribe to RSS Feed
- Permalink
- Report Inappropriate Content
Last 5 Years Sales
Sum({<Year=, Quarter=, Month=, Week=, Date={‘>=$(=YearStart(Max(Date), -4))<=$(=Date(Max(Date)))’}>} Sales )
Last 6 Quarters Sales
Sum({<Year=, Quarter=, Month=, Week=, Date={‘>=$(=QuarterStart(Max(Date), -5))<=$(=Date(Max(Date)))’}>} Sales )
Last 12 Months Sales
Sum({<Year=, Quarter=, Month=, Week=, Date={‘>=$(=MonthStart(Max(Date), -11))<=$(=Date(Max(Date)))’}>} Sales )
Last 15 Weeks Sales
Sum({<Year=, Quarter=, Month=, Week=, Date={‘>=$(=WeekStart(Max(Date), -14))<=$(=Date(Max(Date)))’}>} Sales )
Last 10 Days Sales
Sum({<Year=, Quarter=, Month=, Week=, Date={‘>=$(=Date(Max(Date)-9))<=$(=Date(Max(Date)))’}>} Sales )
Note:
YTD - Year to Date
QTD - Quarter to Date
MTD - Month to Date
WTD - Week to Date
Last YTD for the period selected
Sum({<Year=, Quarter=, Month=, Week=, Date={‘>=$(=YearStart(Max(Date), -1))<=$(=AddYears(Max(Date), -1))’}>} Sales)
Last QTD for the period selected
Sum({<Year=, Quarter=, Month=, Week=, Date={‘>=$(=QuarterStart(Max(Date), -1))<=$(=AddMonths(Max(Date), -3))’}>} Sales)
Last MTD for the period selected
Sum({<Year=, Quarter=, Month=, Week=, Date={‘>=$(=MonthStart(Max(Date), -1))<=$(=AddMonths(Max(Date), -1))’}>} Sales)
Last WTD for the period selected
Sum({<Year=, Quarter=, Month=, Week=, Date={‘>=$(=WeekStart(Max(Date), -1))<=$(=Date(Max(Date) -7))’}>} Sales)
- Mark as New
- Bookmark
- Subscribe
- Mute
- Subscribe to RSS Feed
- Permalink
- Report Inappropriate Content
How do you define the last week of the month ?
You expect output for Jan 2014 is 2332 which is from date 13/01/2014 which does not look like the last week.
- Mark as New
- Bookmark
- Subscribe
- Mute
- Subscribe to RSS Feed
- Permalink
- Report Inappropriate Content
the last week of the month is the last date that I have data, for example, the last week of january in this case:
week(17/01/2014)
| 07/01/2014 | 1000 |
| 17/01/2014 | 2332 |
because is the last date of january that i have data
How i can identify the last date of a month?? is this the data that I want to show in the bar.
with the data tha I have put in mi first post, I want to show in the bar
2014
Jan 2332
Feb 3464
Mar 6344
Aprl 2100
May 6789
Jun 3456
that are the last data of each month
- Mark as New
- Bookmark
- Subscribe
- Mute
- Subscribe to RSS Feed
- Permalink
- Report Inappropriate Content
thank you, but with this I can't resolve my question. I want to show in the bar char with monthname(date) as the dimension the last data of the month. I mark in bold this data:
| date | sales |
| 07/01/2014 | 1000 |
| 17/01/2014 | 2332 |
| 17/02/2014 | 1100 |
| 27/02/2014 | 3464 |
| 20/03/2014 | 1120 |
| 30/03/2014 | 6344 |
| 15/04/2014 | 4333 |
| 30/04/2014 | 2100 |
| 01/05/2014 | 1132 |
| 11/05/2014 | 6789 |
| 09/06/2014 | 1456 |
| 19/06/2014 | 3456 |
| 11/07/2014 | 3654 |
| 21/07/2014 | 3462 |
| 03/08/2014 | 1569 |
| 13/08/2014 | 2356 |
| 08/09/2014 | 5482 |
| 10/09/2014 | 3421 |
| 22/10/2014 | 6652 |
| 29/10/2014 | 7532 |
| 01/11/2014 | 8754 |
| 26/11/2014 | 4125 |
| 16/12/2014 | 6325 |
| 26/12/2014 | 3564 |
| 11/01/2015 | 9856 |
| 21/01/2015 | 3222 |
| 14/02/2015 | 5432 |
| 24/02/2015 | 3464 |
| 13/03/2015 | 4654 |
| 23/03/2015 | 6422 |
| 22/04/2015 | 5489 |
| 30/04/2015 | 3554 |
| 08/05/2015 | 3235 |
| 28/05/2015 | 2145 |
| 05/06/2015 | 5236 |
| 25/06/2015 | 2346 |
thank you!
- Mark as New
- Bookmark
- Subscribe
- Mute
- Subscribe to RSS Feed
- Permalink
- Report Inappropriate Content
If I put
=SUM(if(date='$(=MaxString(date))',sales))
inly show me the data of the last wekk of the last month. I want to show the data of the last week of all month of the year
- Mark as New
- Bookmark
- Subscribe
- Mute
- Subscribe to RSS Feed
- Permalink
- Report Inappropriate Content
Hi!
You could also do this in script. Make little table holding only necessary values. You can then use them as is or for example map those to fact-table.
Example:
I made excel-file from your example data for easy load.
Data:
LOAD date as Date,
sales as Sales,
Year(date)&Num(Month(date),'00') as MonthNum
FROM
(ooxml, embedded labels, table is Sheet1);
tmp1:
Load
Max(Date) as MaxDate,
MonthNum as M
Resident Data
Group By MonthNum;
Left Join
Load
Num(Date) as MaxDate,
Sales as MaxSales
Resident Data;
Now you can easily make chart like this:
Br,
Miikka
Climber Finland
- Mark as New
- Bookmark
- Subscribe
- Mute
- Subscribe to RSS Feed
- Permalink
- Report Inappropriate Content
thank you!!!!!!