Unlock a world of possibilities! Login now and discover the exclusive benefits awaiting you.
- Qlik Community
- :
- All Forums
- :
- QlikView App Dev
- :
- Re: stacked bar chart with reference line (kind of...
- Subscribe to RSS Feed
- Mark Topic as New
- Mark Topic as Read
- Float this Topic for Current User
- Bookmark
- Subscribe
- Mute
- Printer Friendly Page
- Mark as New
- Bookmark
- Subscribe
- Mute
- Subscribe to RSS Feed
- Permalink
- Report Inappropriate Content
stacked bar chart with reference line (kind of)
Hi all,
is it possible to have a reference line similar to the one in the attached chart?
about the chart:
horizontal stacked car chart,
dimension = geographic address and Time
expression = 1/60 to represent minutes
bar colour expression = avg(speed)
the chart is uses the colour of the bar to represent speed each minute across the day and select location.
now what i would like is a reference line (or similar) that for example starts at 10 oclock at site M55/5248K and ends at 2 oclock.
is this possible?
kindest,
- Mark as New
- Bookmark
- Subscribe
- Mute
- Subscribe to RSS Feed
- Permalink
- Report Inappropriate Content
So do you want a vertical line at 10 and another at 2?
If so then you should just be able to define a couple of reference lines as normal (I think!)
- Mark as New
- Bookmark
- Subscribe
- Mute
- Subscribe to RSS Feed
- Permalink
- Report Inappropriate Content
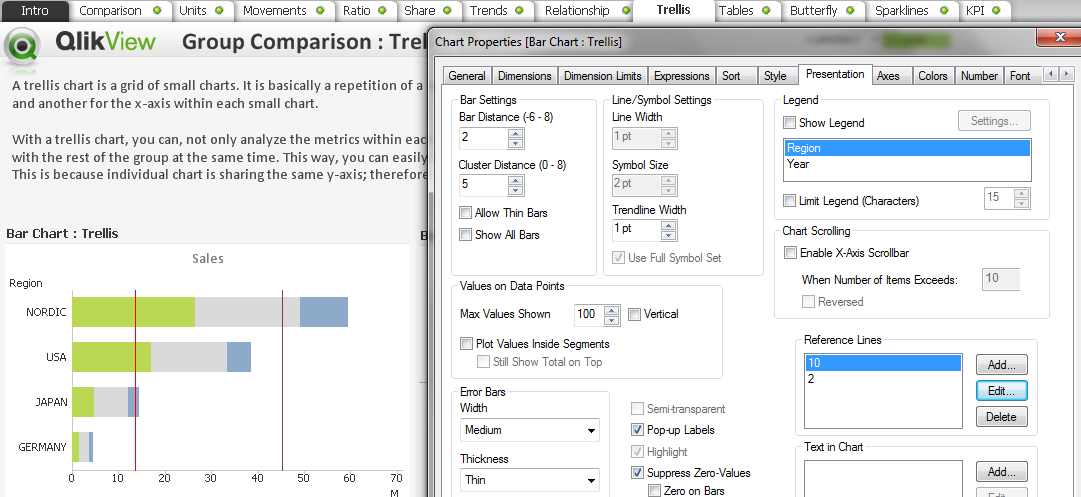
Hi
You can add reference line in bar graph under Presentation in reference line section based on the condition, refer screen shot below for info.
Hope this help
- Mark as New
- Bookmark
- Subscribe
- Mute
- Subscribe to RSS Feed
- Permalink
- Report Inappropriate Content
Hi all,
thanks for the responses, im familiar with the reference lines however if you look in the image this isnt quite what im after.
its not looking like its possible without an extension i was wondering if anyone had any ideas,
- Mark as New
- Bookmark
- Subscribe
- Mute
- Subscribe to RSS Feed
- Permalink
- Report Inappropriate Content
Sorry that was a part of my response, the image doesn't really make it clear what you're after.
So its not a line at 10 and 2, do you want to fill each bar with red between 10 and 2?
- Mark as New
- Bookmark
- Subscribe
- Mute
- Subscribe to RSS Feed
- Permalink
- Report Inappropriate Content
my apologies.
abit of background to explain a little better.
the chart represents speed along a road, at various locations there are message signs that switch on and off at certain points. i want my line to represent them switching on and off.
i could change the colour of the bar to represent this however im working to a spec and have to deliver certain functionality.