Unlock a world of possibilities! Login now and discover the exclusive benefits awaiting you.
- Qlik Community
- :
- All Forums
- :
- QlikView App Dev
- :
- Re: stacked chart with 2 tables
- Subscribe to RSS Feed
- Mark Topic as New
- Mark Topic as Read
- Float this Topic for Current User
- Bookmark
- Subscribe
- Mute
- Printer Friendly Page
- Mark as New
- Bookmark
- Subscribe
- Mute
- Subscribe to RSS Feed
- Permalink
- Report Inappropriate Content
stacked chart with 2 tables
arrrggggggghhhhh
I am having an issue with creating a stacked chart using the same field from 2 different tables.
In my load script, i have the following:
Table 1:
incident_data:
LOAD
FLD_TICKETID,
Start_dttm,
%_Service_Provider,
MonthName([Start_dttm]) as Create_Month,
%_Req_Closed,
MonthName ([%_Req_Closed]) as Resolve_Month,
FLD_RESOLUTIONRESOLVEDPERSON as Resolve_inc,
Status,
FLD_CUSTOMER,
FLD_INITIATEDBYSOURCECHAR,
CATEGORY,
FLD_TICKETPRIORITY,
FROM
$(QVDPathFinal)\OP_Request_final.qvd
(qvd)
where not WildMatch(Status,'Withdrawn') AND %_Service_Provider='Smart M2M';
and table 2 i have:
Request_Tickets:
LOAD
FLD_TICKETID as Request_ID,
%_WO_Req_Started,
Date(MonthName(%_WO_Req_Started),'MMM-YY') as Create_Month,
%_WO_Req_Ended,
Date(MonthName(%_WO_Req_Ended),'MMM-YY') as Resolve_Month,
FLD_REQUESTDATE,
FLD_REQUESTTYPE as Request_Type_for_Request,
FLD_TICKETPRIORITY as Req_priority,
Age as [Req Open Time],
//FLD_REQUESTSTATUS,
FLD_REQUESTSTATUS as Status,
FROM
$(QVDPathFinal)\WO_Request_final.qvd
(qvd);
So i have created an alias for 'Status' in the Request_tickets table to match that of the incident_data field called 'Status'.
However, i am getting a synthetic key, and the chart looks like the attached along with the properties.
Plus my data model is attached.
Please note that due to the sensitivity of the data, i cant send the QVW or the raw data.
Do i need to create a join, concatenate, or some other wizardry to get the chart to work correctly?
Thanks ever so much in advance
Accepted Solutions
- Mark as New
- Bookmark
- Subscribe
- Mute
- Subscribe to RSS Feed
- Permalink
- Report Inappropriate Content
I think you issue is the fact that the two tables have different way they show the field Status
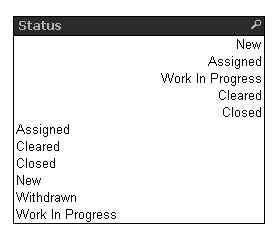
You can fix this on the front end using Trim(Status), but I would recommend fixing this in the script as that will save your some space and save you from any front end manipulation of the fields.
So, try like this:
incident_data:
LOAD
FLD_TICKETID,
Start_dttm,
%_Service_Provider,
MonthName([Start_dttm]) as Create_Month,
%_Req_Closed,
MonthName ([%_Req_Closed]) as Resolve_Month,
FLD_RESOLUTIONRESOLVEDPERSON as Resolve_inc,
Trim(Status) as Status,
FLD_CUSTOMER,
FLD_INITIATEDBYSOURCECHAR,
CATEGORY,
FLD_TICKETPRIORITY,
FROM
$(QVDPathFinal)\OP_Request_final.qvd
(qvd)
where not WildMatch(Status,'Withdrawn') AND %_Service_Provider='Smart M2M';
and the second one
Request_Tickets:
LOAD
FLD_TICKETID as Request_ID,
%_WO_Req_Started,
Date(MonthName(%_WO_Req_Started),'MMM-YY') as Create_Month,
%_WO_Req_Ended,
Date(MonthName(%_WO_Req_Ended),'MMM-YY') as Resolve_Month,
FLD_REQUESTDATE,
FLD_REQUESTTYPE as Request_Type_for_Request,
FLD_TICKETPRIORITY as Req_priority,
Age as [Req Open Time],
//FLD_REQUESTSTATUS,
Trim(FLD_REQUESTSTATUS) as Status,
FLD_SUBMITTER as [req creator],
Assignee,
CATEGORY as Req_Category,
H_CREATORGROUP as req_create_Group,
FLD_REPORTING_CLOSEDTIME,
FLD_RESOLUTIONRESOLVEDGROUP as req_resolve_group,
FLD_RESOLUTIONRESOLVEDPERSON as resolve_req,
FLD_COMPLETIONCODE,
AssignedTeam as [Assignment Profile],
FLD_CUSTOMER, //as req_customer,
FLD_DESCRIPTION as request_description,
H_TIME_SECS_INASSIGNED as Req_reponse,
H_TIMETOTALINSECS as Req_open_time
FROM
$(QVDPathFinal)\WO_Request_final.qvd
(qvd);
I think once you make this change, your chart should automatically be fixed. No more changes should be required.
Best,
Sunny
- Mark as New
- Bookmark
- Subscribe
- Mute
- Subscribe to RSS Feed
- Permalink
- Report Inappropriate Content
See if this link helps you offer a sample to us
Preparing examples for Upload - Reduction and Data Scrambling
- Mark as New
- Bookmark
- Subscribe
- Mute
- Subscribe to RSS Feed
- Permalink
- Report Inappropriate Content
Hi.
i have attached the QVW with scrambled data.
the chart i am referring to is in the High level summary tab, and its the ticket status chart that i have the issue with
Thanks in advance
- Mark as New
- Bookmark
- Subscribe
- Mute
- Subscribe to RSS Feed
- Permalink
- Report Inappropriate Content
Hi Aaron,
Try Like this:
incident_data:
LOAD
FLD_TICKETID as Request_ID,
Start_dttm,
%_Service_Provider,
MonthName([Start_dttm]) as Create_Month,
%_Req_Closed,
MonthName ([%_Req_Closed]) as Resolve_Month,
FLD_RESOLUTIONRESOLVEDPERSON as Resolve_inc,
Status,
FLD_CUSTOMER,
FLD_INITIATEDBYSOURCECHAR,
CATEGORY,
FLD_TICKETPRIORITY,
'Incident' as Flag
FROM
$(QVDPathFinal)\OP_Request_final.qvd
(qvd)
where not WildMatch(Status,'Withdrawn') AND %_Service_Provider='Smart M2M';
concatenate (incident_data)
Request_Tickets:
LOAD
FLD_TICKETID as Request_ID,
%_WO_Req_Started,
Date(MonthName(%_WO_Req_Started),'MMM-YY') as Create_Month,
%_WO_Req_Ended,
Date(MonthName(%_WO_Req_Ended),'MMM-YY') as Resolve_Month,
FLD_REQUESTDATE,
FLD_REQUESTTYPE as Request_Type_for_Request,
FLD_TICKETPRIORITY as Req_priority,
Age as [Req Open Time],
//FLD_REQUESTSTATUS,
FLD_REQUESTSTATUS as Status,
'Request' as Flag
FROM
$(QVDPathFinal)\WO_Request_final.qvd
(qvd);
Exp1: count({<Flag={'Incident'}>}Request_ID)
Exp2: count({<Flag={'Request'}>}Request_ID)
Dim: Status
Regards
KC
KC
- Mark as New
- Bookmark
- Subscribe
- Mute
- Subscribe to RSS Feed
- Permalink
- Report Inappropriate Content
Hi KC,
Thanks for the code.
The result, believe it or not, is the same, plus it does not resolve my issue of the synthetic Keys.
I have uploaded a QVW with scrambled data, which you can have a look at if you get the time.
Thanks in advance
- Mark as New
- Bookmark
- Subscribe
- Mute
- Subscribe to RSS Feed
- Permalink
- Report Inappropriate Content
Hi Aaron,
Simply change your dimension to:
=trim(Status)
Regards
KC
KC
- Mark as New
- Bookmark
- Subscribe
- Mute
- Subscribe to RSS Feed
- Permalink
- Report Inappropriate Content
I think you issue is the fact that the two tables have different way they show the field Status
You can fix this on the front end using Trim(Status), but I would recommend fixing this in the script as that will save your some space and save you from any front end manipulation of the fields.
So, try like this:
incident_data:
LOAD
FLD_TICKETID,
Start_dttm,
%_Service_Provider,
MonthName([Start_dttm]) as Create_Month,
%_Req_Closed,
MonthName ([%_Req_Closed]) as Resolve_Month,
FLD_RESOLUTIONRESOLVEDPERSON as Resolve_inc,
Trim(Status) as Status,
FLD_CUSTOMER,
FLD_INITIATEDBYSOURCECHAR,
CATEGORY,
FLD_TICKETPRIORITY,
FROM
$(QVDPathFinal)\OP_Request_final.qvd
(qvd)
where not WildMatch(Status,'Withdrawn') AND %_Service_Provider='Smart M2M';
and the second one
Request_Tickets:
LOAD
FLD_TICKETID as Request_ID,
%_WO_Req_Started,
Date(MonthName(%_WO_Req_Started),'MMM-YY') as Create_Month,
%_WO_Req_Ended,
Date(MonthName(%_WO_Req_Ended),'MMM-YY') as Resolve_Month,
FLD_REQUESTDATE,
FLD_REQUESTTYPE as Request_Type_for_Request,
FLD_TICKETPRIORITY as Req_priority,
Age as [Req Open Time],
//FLD_REQUESTSTATUS,
Trim(FLD_REQUESTSTATUS) as Status,
FLD_SUBMITTER as [req creator],
Assignee,
CATEGORY as Req_Category,
H_CREATORGROUP as req_create_Group,
FLD_REPORTING_CLOSEDTIME,
FLD_RESOLUTIONRESOLVEDGROUP as req_resolve_group,
FLD_RESOLUTIONRESOLVEDPERSON as resolve_req,
FLD_COMPLETIONCODE,
AssignedTeam as [Assignment Profile],
FLD_CUSTOMER, //as req_customer,
FLD_DESCRIPTION as request_description,
H_TIME_SECS_INASSIGNED as Req_reponse,
H_TIMETOTALINSECS as Req_open_time
FROM
$(QVDPathFinal)\WO_Request_final.qvd
(qvd);
I think once you make this change, your chart should automatically be fixed. No more changes should be required.
Best,
Sunny
- Mark as New
- Bookmark
- Subscribe
- Mute
- Subscribe to RSS Feed
- Permalink
- Report Inappropriate Content
Thank you KC.
- Mark as New
- Bookmark
- Subscribe
- Mute
- Subscribe to RSS Feed
- Permalink
- Report Inappropriate Content
Thank you Sunny.
Works perfectly.
I am learning everyday, and your advice and expertise is invaluable
Kind regards
Aaron