Unlock a world of possibilities! Login now and discover the exclusive benefits awaiting you.
- Qlik Community
- :
- All Forums
- :
- QlikView App Dev
- :
- Re: time pie chart
- Subscribe to RSS Feed
- Mark Topic as New
- Mark Topic as Read
- Float this Topic for Current User
- Bookmark
- Subscribe
- Mute
- Printer Friendly Page
- Mark as New
- Bookmark
- Subscribe
- Mute
- Subscribe to RSS Feed
- Permalink
- Report Inappropriate Content
time pie chart
Hello community,
I have a table that contains measures about timings
Every row contains the timing of a case (that an agent spent to accomplich his task) SLA GLOBALE and a field SLA that contains the timing should be spent in evry task
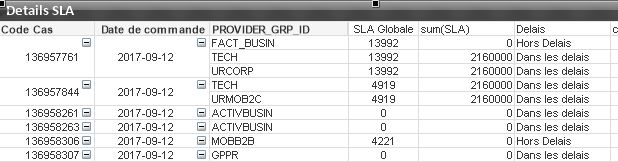
i CREATED a calculated field to knwo witsh case are in time and witch one are out of time
SLA globale : =Interval(Sum(TOTAL <[Code Cas], [Date de commande], SLA_GLOBAL, [Statut Cas]> Interval#(SLA_GLOBAL, 's')), 'm')
SLA = SUM(sla)
Delais : if(Column(1)>Column(2),'Hors Delais','Dans les delais')
I need to create a pie chart that contains number of case in time and number of case out of time
ANY idea please? i need your help
Accepted Solutions
- Mark as New
- Bookmark
- Subscribe
- Mute
- Subscribe to RSS Feed
- Permalink
- Report Inappropriate Content
Maybe like this:
Calculated dimension:
=Aggr(
If( Sum(TOTAL <[Code Cas], [Date de commande], SLA_GLOBAL, [Statut Cas]> Interval#(SLA_GLOBAL, 's')) > SUM(sla)
,'Hors Delais'
,'Dans les delais')
,[Code Cas], PROVIDER_GRP_ID)
//not sure about the aggr dimensions needed, basically add all your chart dimensions shown above
Expression:
=Count(DISTINCT [Code Cas] &'/'& PROVIDER_GRP_ID)
//Again, create a value to count as combination of your aggr() dimensions
- Mark as New
- Bookmark
- Subscribe
- Mute
- Subscribe to RSS Feed
- Permalink
- Report Inappropriate Content
Thanks Stefan 
Have a nice day