Unlock a world of possibilities! Login now and discover the exclusive benefits awaiting you.
- Qlik Community
- :
- All Forums
- :
- QlikView App Dev
- :
- top 5 sales base on selection
- Subscribe to RSS Feed
- Mark Topic as New
- Mark Topic as Read
- Float this Topic for Current User
- Bookmark
- Subscribe
- Mute
- Printer Friendly Page
- Mark as New
- Bookmark
- Subscribe
- Mute
- Subscribe to RSS Feed
- Permalink
- Report Inappropriate Content
top 5 sales base on selection
Hi All,
SUM({$<FinancialYear=,FiscalYear={$(=max(FiscalYear))},MonthName=,Quarter=
,[ Date]={">=$(=YearStart(max({$<FiscalYear={$(=max(FiscalYear))}>}
[Date]),0,4))<=$(=max({$<FiscalYear={$(=max(FiscalYear))}>}[ Date]))"}
>}[Sales])
I have above expression and i want show top 5 state ytd sale base on the selection need to show top 5 sale individually in different txt object.
Accepted Solutions
- Mark as New
- Bookmark
- Subscribe
- Mute
- Subscribe to RSS Feed
- Permalink
- Report Inappropriate Content
Hi ,
Do check this too,
HTH,
Hirish
“Aspire to Inspire before we Expire!”
- Mark as New
- Bookmark
- Subscribe
- Mute
- Subscribe to RSS Feed
- Permalink
- Report Inappropriate Content
Hi you can do like this,
In your table,
Dimension:-
- YTD
- =if(aggr(rank(
SUM({$<FinancialYear=,FiscalYear={$(=max(FiscalYear))},MonthName=,Quarter=
,[ Date]={">=$(=YearStart(max({$<FiscalYear={$(=max(FiscalYear))}>}
[Date]),0,4))<=$(=max({$<FiscalYear={$(=max(FiscalYear))}>}[ Date]))"}
>}[Sales])),State)<=5,State)
Expression:
SUM({$<FinancialYear=,FiscalYear={$(=max(FiscalYear))},MonthName=,Quarter=
,[ Date]={">=$(=YearStart(max({$<FiscalYear={$(=max(FiscalYear))}>}
[Date]),0,4))<=$(=max({$<FiscalYear={$(=max(FiscalYear))}>}[ Date]))"}
>}[Sales])
Another way in text box,
='State and Their respective Sales ' &Concat(if(aggr(rank(
SUM({$<FinancialYear=,FiscalYear={$(=max(FiscalYear))},MonthName=,Quarter=
,[ Date]={">=$(=YearStart(max({$<FiscalYear={$(=max(FiscalYear))}>}
[Date]),0,4))<=$(=max({$<FiscalYear={$(=max(FiscalYear))}>}[ Date]))"}
>}[Sales])),State)<=5,
Aggr(State&CHR(9)&MONEY(SUM(Sales),'#,##0'),State)),', '&CHR(10),-Aggr(SUM(Sales),State))
Hope this Helps,
PFA,
Hirish
“Aspire to Inspire before we Expire!”
- Mark as New
- Bookmark
- Subscribe
- Mute
- Subscribe to RSS Feed
- Permalink
- Report Inappropriate Content
You can do it in 3 way:
1) Already suggested by Hirish
2) Properties -> Dimension Limit ->Tick(Which Restrict option) -> Show Largest 5 values
3) Properties -> Presentation -> Chart Scrolling -> Enable X Axis Scroll Bar -> When Number of Item Exceeds=5
And Make sure your expression either in ascending or descending
- Mark as New
- Bookmark
- Subscribe
- Mute
- Subscribe to RSS Feed
- Permalink
- Report Inappropriate Content
Hi All,
I want this values in Text object.
If user select 2014-2015 then respect to year in text object it will show ytd sales for state .
In below text object I want ytd sales for top 5 states .
suppose first is Maharashtra then first object should display maha... state ytd sale.

Thanks
- Mark as New
- Bookmark
- Subscribe
- Mute
- Subscribe to RSS Feed
- Permalink
- Report Inappropriate Content
- Mark as New
- Bookmark
- Subscribe
- Mute
- Subscribe to RSS Feed
- Permalink
- Report Inappropriate Content
Hi,
Do check my modified post above.
-Hirish
“Aspire to Inspire before we Expire!”
- Mark as New
- Bookmark
- Subscribe
- Mute
- Subscribe to RSS Feed
- Permalink
- Report Inappropriate Content
Hi ,
Do check this too,
HTH,
Hirish
“Aspire to Inspire before we Expire!”
- Mark as New
- Bookmark
- Subscribe
- Mute
- Subscribe to RSS Feed
- Permalink
- Report Inappropriate Content
Hi Hirish,
You solution is working fine but I dont want state name from that txt object only want sales.
Thanks
- Mark as New
- Bookmark
- Subscribe
- Mute
- Subscribe to RSS Feed
- Permalink
- Report Inappropriate Content
Hi ,
Change of expression in text Box like this,
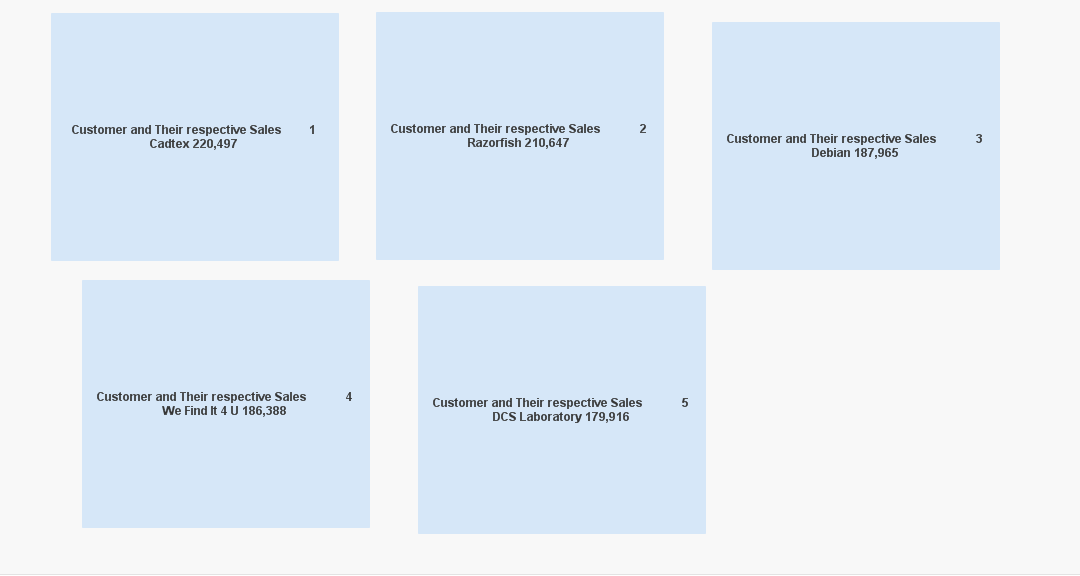
='Customer and Their respective Sales 2
' &Concat(if(aggr(rank(sum(Sales)),Customer)=2,Aggr(MONEY(SUM(Sales),'#,##0'),Customer)),', '&CHR(10),-Aggr(SUM(Sales),Customer))
-Hirish
“Aspire to Inspire before we Expire!”