Unlock a world of possibilities! Login now and discover the exclusive benefits awaiting you.
- Qlik Community
- :
- All Forums
- :
- QlikView App Dev
- :
- Re: urgent help - is this possible ?? how to achiv...
- Subscribe to RSS Feed
- Mark Topic as New
- Mark Topic as Read
- Float this Topic for Current User
- Bookmark
- Subscribe
- Mute
- Printer Friendly Page
- Mark as New
- Bookmark
- Subscribe
- Mute
- Subscribe to RSS Feed
- Permalink
- Report Inappropriate Content
urgent help - is this possible ?? how to achive this in pivot table..??
Hi All,
am trying to get the totals at the end of each row in a pivot table.
Please find the attached sample data and am looking for the below senario using pivot table..
in the below table code, location and Division are dims and total occupency and available vacancy are the expressions.
am trying to get the below type of chart. but in my chart each expression is divided by each dimension and am not able to get the below type of charts.
Please guide me on how to build this type of chart. Thanks Much.
| Division | |||||||||
| Code | Location | Mobile | Media | Wifi | TV | router | Callers | total occupency | available vacancy |
| A100 | London | 46 | 41 | 42 | 43 | 87 | 86 | 345 | 380 |
| A101 | EU | 54 | 43 | 34 | 19 | 17 | 18 | 185 | 400 |
| A102 | Japan | 62 | 45 | 36 | 22 | 24 | 23 | 212 | 420 |
| A103 | USA | 70 | 47 | 38 | 25 | 31 | 28 | 239 | 440 |
| A104 | Africa | 78 | 49 | 40 | 28 | 38 | 33 | 266 | 460 |
| A105 | Asia | 86 | 51 | 42 | 31 | 45 | 38 | 293 | 480 |
| A106 | India | 94 | 53 | 44 | 34 | 52 | 43 | 320 | 500 |
| A107 | China | 102 | 55 | 46 | 37 | 59 | 48 | 347 | 520 |
| A108 | Iron | 110 | 57 | 48 | 40 | 66 | 53 | 374 | 540 |
| A109 | France | 118 | 59 | 50 | 43 | 73 | 58 | 401 | 560 |
| A110 | Germany | 126 | 61 | 52 | 46 | 80 | 63 | 428 | 580 |
- Mark as New
- Bookmark
- Subscribe
- Mute
- Subscribe to RSS Feed
- Permalink
- Report Inappropriate Content
Hi Vishal,
This seems to be the case to use Crosstable() statement.
x:
LOAD Code,
    Location,
    Mobile,
    Media,
    Wifi,
    TV,
    router,
    Callers
FROM

(ooxml, embedded labels, table is Plan1);

Cross:
CrossTable(Type,Value)
Load
Location,
    Mobile,
    Media,
    Wifi,
    TV,
    router,
    Callers
Resident x;

NewData:
Load
Distinct
Code,
Location
Resident x;

left join (NewData)
Load
*
Resident Cross;

drop tables Cross,x;
Attached the sample file i used (just copied your data into a spreadsheet.
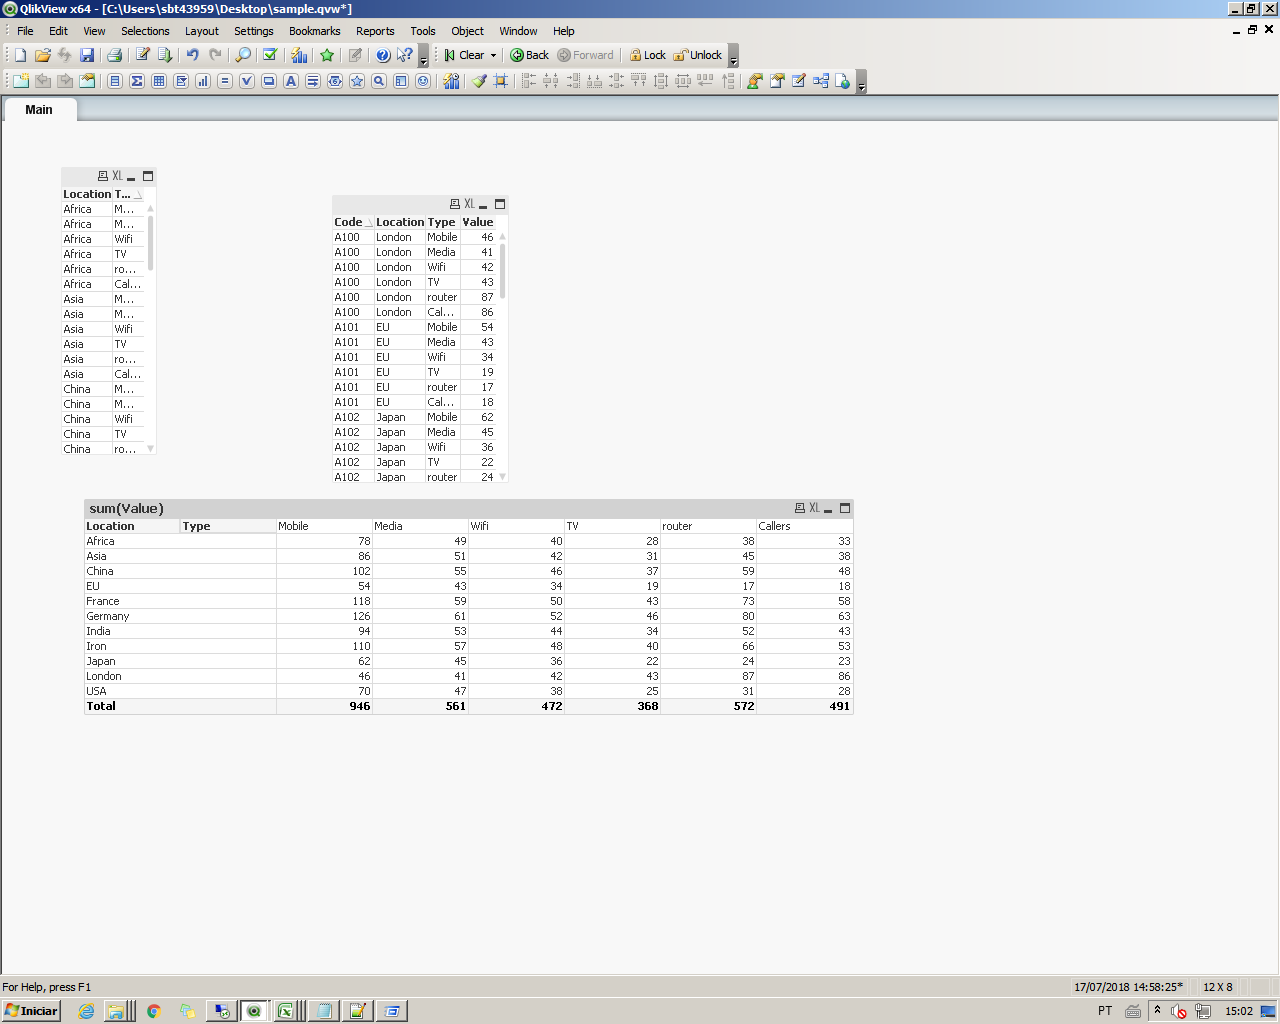
With that, I got the following with a simple sum(Value) expression:
- Mark as New
- Bookmark
- Subscribe
- Mute
- Subscribe to RSS Feed
- Permalink
- Report Inappropriate Content
Thanks Felip for your valuable time on this.
Hope my ask may not be clear to you, sorry for that.
i have 3 dimenstions and one expression out of these 2 dimension are normal and one should be pivoted. so the result should look like the above sample pivot table i have given in my post. there division is the third dimension and total occupency is my expression. is it possible to get the total column for the expression like i shown in above post.
if we sum up all the values in the first row we have to get 345. and value should come in a separate column as total which is not available in pivot table.
Any possibility to achive this with 3 dimensions, just got to know that with 2 dims its possible. any extension will help us to achieve this..??
Thanks Much Again !!
- Mark as New
- Bookmark
- Subscribe
- Mute
- Subscribe to RSS Feed
- Permalink
- Report Inappropriate Content
Sure,
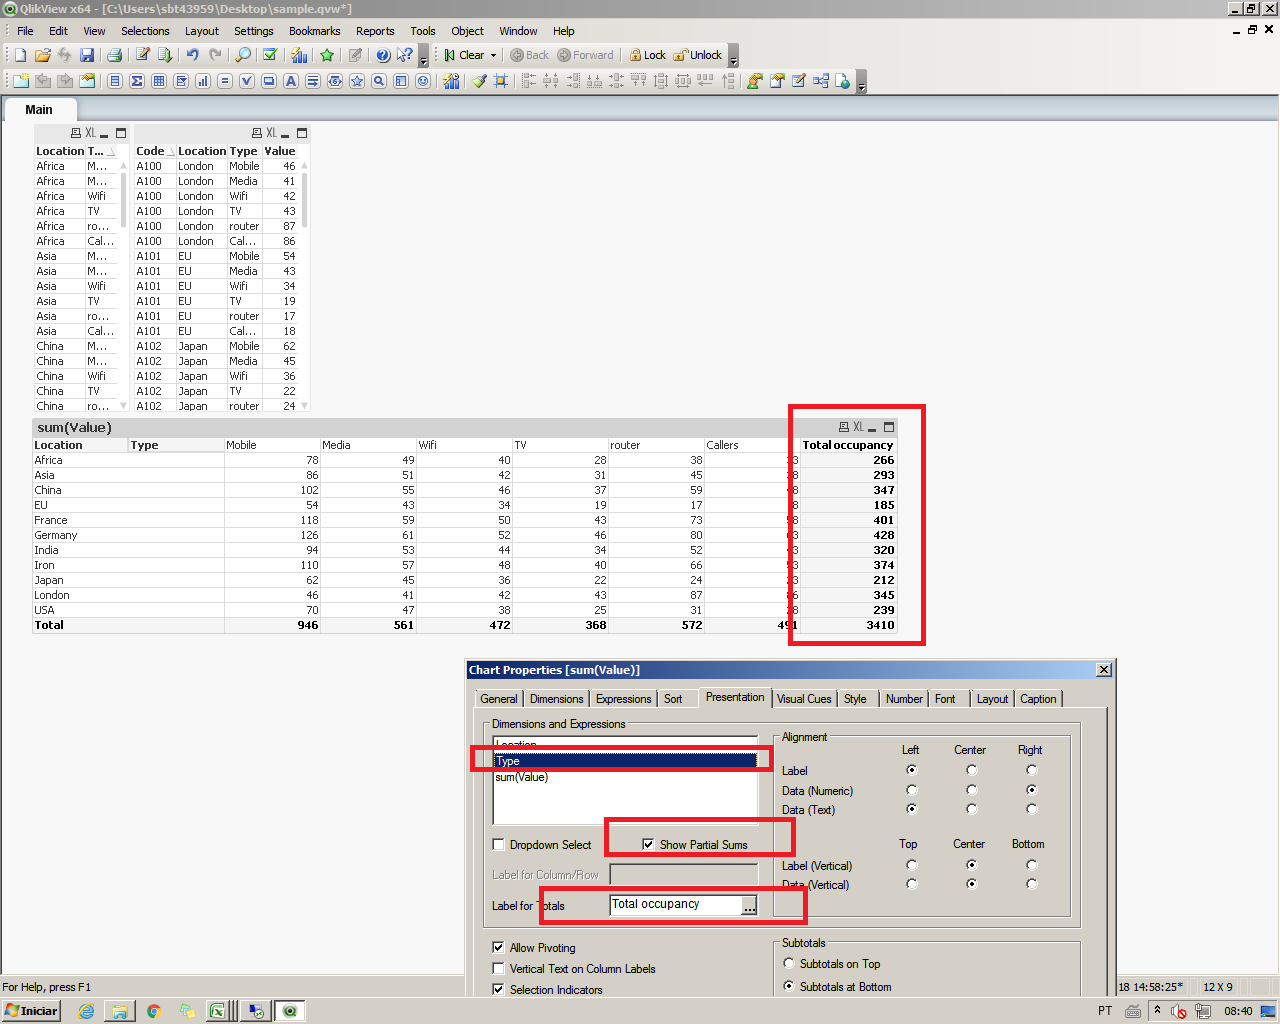
Use the partial sums on the pivoted dimension and rename the column like this:
- Mark as New
- Bookmark
- Subscribe
- Mute
- Subscribe to RSS Feed
- Permalink
- Report Inappropriate Content
Thanks again, till this it was fine, but when we add another expression it was calcuting that expression to each and every pivoted dimention which i dont want.
i want to calculate the expression : available Space.
and the above expression should come with an another column beside total occupency, so that i can calculate the % of occupency.
seems like for my second expression dim 2 and dim 3 needs to be disabled in the calculation..or some thing around this...
can we disable some dims while calculating the expression...??? is this possible... ???
please let me know if my above requirement is not clear...
- Mark as New
- Bookmark
- Subscribe
- Mute
- Subscribe to RSS Feed
- Permalink
- Report Inappropriate Content
Attached a sample QVW, with the following result:
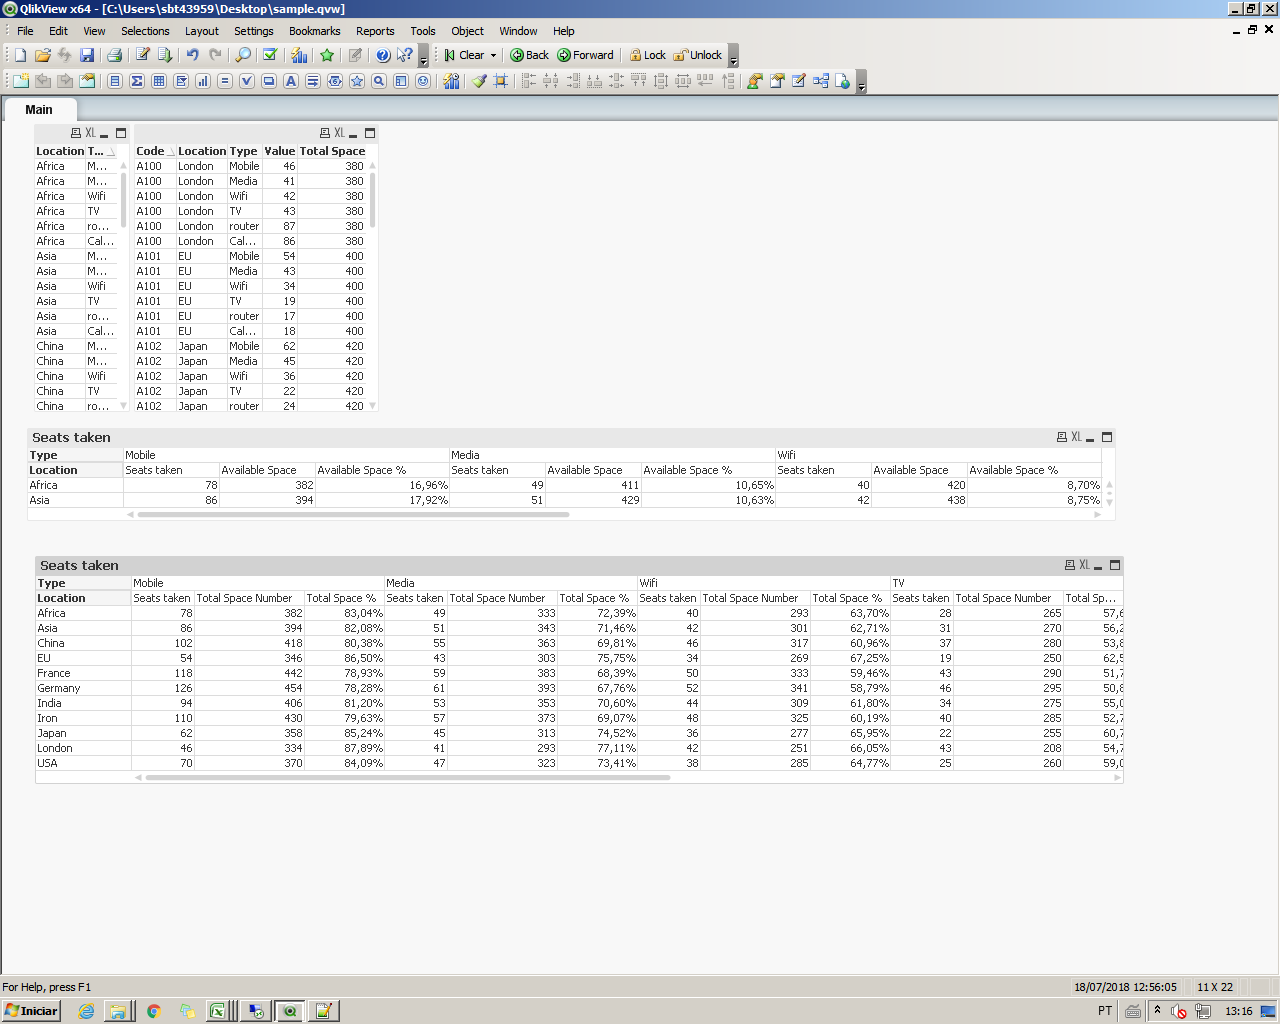
More then that, you're probably better with a straight table anyway.
- Mark as New
- Bookmark
- Subscribe
- Mute
- Subscribe to RSS Feed
- Permalink
- Report Inappropriate Content
Thanks Much Felip,
we are near to the solution, can you please check my origincal post where i have given my exact requirement.
the second expression that we added must be calculated only once, and that to at the end beside the total occupency
am not sure on its possibility.
in your above solution second expression is calculated for all the 3rd dimension values. Please check my main post.
Thanks again for your time...
- Mark as New
- Bookmark
- Subscribe
- Mute
- Subscribe to RSS Feed
- Permalink
- Report Inappropriate Content
That's the behaviour of the pivot table, you won't be able to calculate the expression only once for all the dimensions.
I'll have to use a straght table for that.