Unlock a world of possibilities! Login now and discover the exclusive benefits awaiting you.
- Qlik Community
- :
- Support
- :
- Support
- :
- Knowledge
- :
- Member Articles
- :
- Bollinger Bands
- Move Document
- Delete Document
- Subscribe to RSS Feed
- Mark as New
- Mark as Read
- Bookmark
- Subscribe
- Printer Friendly Page
- Report Inappropriate Content
Bollinger Bands
- Move Document
- Delete Document and Replies
- Mark as New
- Bookmark
- Subscribe
- Mute
- Subscribe to RSS Feed
- Permalink
- Report Inappropriate Content
Bollinger Bands
Sep 25, 2024 2:23:26 PM
Mar 5, 2016 11:57:26 AM
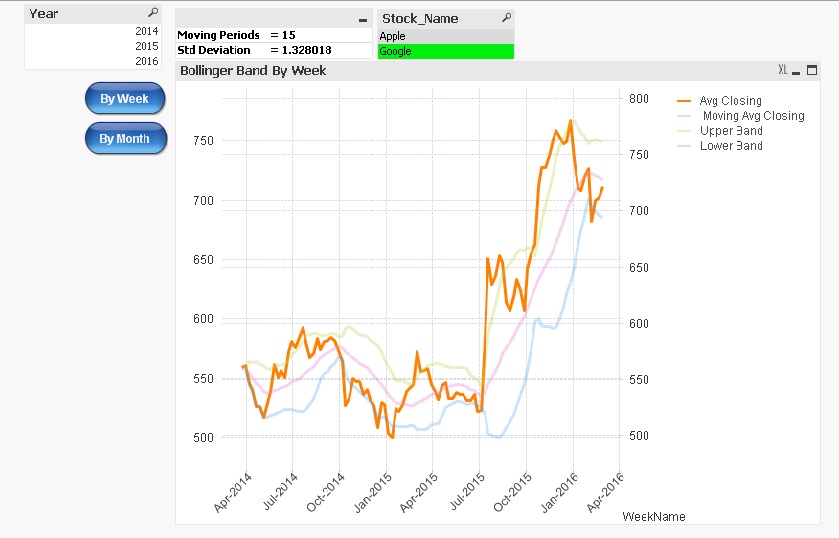
This article provides an overview of Bollinger Bands.
Many traders use Bollinger Bands to determine overbought and oversold levels, selling when price touches the upper Bollinger Band and buying when it hits the lower Bollinger Band.
Components of Bollinger Bands
1) Avg Stock Price
It's simple Avg of stock price.
2) Moving Avg of Stock Price
It's Moving Avg of Stock price over last n Period
3) Upper Band
Moving Avg of Stock Price + Std Deviation over last n Period * Std Deviation Multiplier
4) Lower Band
Moving Avg of Stock Price - Std Deviation over last n Period * Std Deviation Multiplier
Note :
-
Users can select their own moving period and standard deviation multiplier.
-
When viewing the Bollinger Bands on a weekly basis, users can choose a moving period ranging from 1 to 50.
-
When viewing the Bollinger Bands on a monthly basis, users can select a moving period ranging from 1 to 10.
-
The standard deviation multiplier can be inputted from 0.01 to 4.
Please refer to the attached application.
Additionally, please see:
- Move Comment
- Delete Comment
- Mark as Read
- Mark as New
- Bookmark
- Permalink
- Report Inappropriate Content
Nice Once Kushal . . .
- Move Comment
- Delete Comment
- Mark as Read
- Mark as New
- Bookmark
- Permalink
- Report Inappropriate Content
Good One Kushal. Useful information.
- Move Comment
- Delete Comment
- Mark as Read
- Mark as New
- Bookmark
- Permalink
- Report Inappropriate Content
Very nice article
- Move Comment
- Delete Comment
- Mark as Read
- Mark as New
- Bookmark
- Permalink
- Report Inappropriate Content
Nice article sir thank you for the information will help us a lot in portfolio management function
- Move Comment
- Delete Comment
- Mark as Read
- Mark as New
- Bookmark
- Permalink
- Report Inappropriate Content
Good ,keep it up
- Move Comment
- Delete Comment
- Mark as Read
- Mark as New
- Bookmark
- Permalink
- Report Inappropriate Content
Good Article Kushal..
- Move Comment
- Delete Comment
- Mark as Read
- Mark as New
- Bookmark
- Permalink
- Report Inappropriate Content
Nice Article Kushal. Thanks
- Move Comment
- Delete Comment
- Mark as Read
- Mark as New
- Bookmark
- Permalink
- Report Inappropriate Content
Good One. Useful information. It will help people who want to create stock charts
- Move Comment
- Delete Comment
- Mark as Read
- Mark as New
- Bookmark
- Permalink
- Report Inappropriate Content
Thank you for the interesting information.
- Move Comment
- Delete Comment
- Mark as Read
- Mark as New
- Bookmark
- Permalink
- Report Inappropriate Content
Any chance you have a version of this application that is compatible with Qlik Sense?