- Mark as New
- Bookmark
- Subscribe
- Mute
- Subscribe to RSS Feed
- Permalink
- Report Inappropriate Content
Cumulative growth month on month in Bar Chart
Hello Everyone!
I am looking to create a bar chart showing month on month growth rates. I would like to see cumulative growth month on month along with a trend line so that the period where sales went down could be easily extracted, for the respective product. Please let me know how I can achieve this?
Best Regards,
Rony
- Tags:
- qlik_sense_usability
- « Previous Replies
- Next Replies »
Accepted Solutions
- Mark as New
- Bookmark
- Subscribe
- Mute
- Subscribe to RSS Feed
- Permalink
- Report Inappropriate Content
Would you agree that you already have "Cumulative Growth 18 vs 17"? For "Growth 18 vs 17", try this expression
Sum({<[YearMonth.autoCalendar.Year] = {"$(=Year(Max([YearMonth.autoCalendar.Year])))"}>}Volume)/
Sum({<[YearMonth.autoCalendar.Year] = {"$(=Year(Max([YearMonth.autoCalendar.Year]))-1)"}>}Volume) - 1
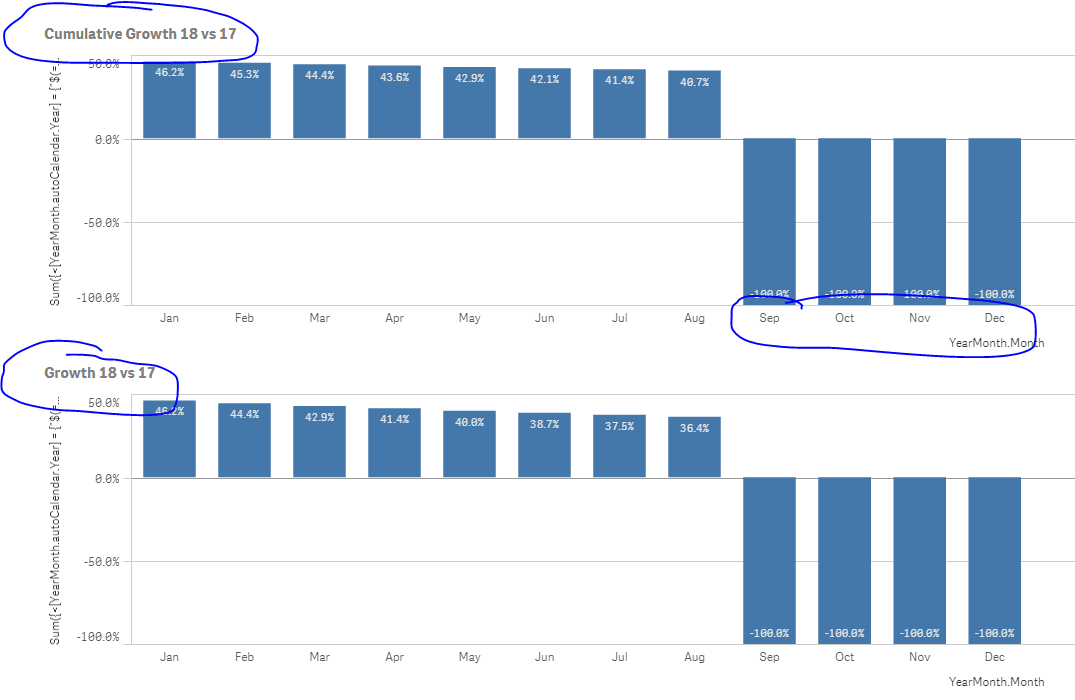
We see -100% for Sep, Oct, Nov, and Dec for obvious reasons that there is no data available for Sep, Oct, Nov, and Dec of 2018 which is why the percentage is -100%. If you can to get ride of this, you can add an if statement to remove it... If(Sum(Volume) <> 0, then do something, otherwise do nothing)
- Mark as New
- Bookmark
- Subscribe
- Mute
- Subscribe to RSS Feed
- Permalink
- Report Inappropriate Content
Hi Ron,
You can try the
RangeSum(Above(Sum(Growth),0,12)) to get cumulative growth for the last 12 months for instance.
- Mark as New
- Bookmark
- Subscribe
- Mute
- Subscribe to RSS Feed
- Permalink
- Report Inappropriate Content
Hi Niclas,
How to get this as cumulative growth percent along with a trend line? Also, I have data from Jan-2014 to July-2017. That takes the total no. of months to 55. Please explain this part too.
Rony
- Mark as New
- Bookmark
- Subscribe
- Mute
- Subscribe to RSS Feed
- Permalink
- Report Inappropriate Content
Hi Guys,
Any suggestions on this. I want to get a cumulative growth percentage, month on month. Please advise.
Rony
- Mark as New
- Bookmark
- Subscribe
- Mute
- Subscribe to RSS Feed
- Permalink
- Report Inappropriate Content
Niclas,
Any response on this?
Rony
- Mark as New
- Bookmark
- Subscribe
- Mute
- Subscribe to RSS Feed
- Permalink
- Report Inappropriate Content
Hi,
You add the calculation of percentage as the expression that is now noted as Sum(Growth). And for accumulated indefinitely change the 0,12 to 0,999 which will calculate for 999 months which should be plenty.
How Above() works you can see here:
As for trendline, why not use the built-in one that you can just add by check-mark?
- Mark as New
- Bookmark
- Subscribe
- Mute
- Subscribe to RSS Feed
- Permalink
- Report Inappropriate Content
Niclas,
Could you give me the exact expression to change it to percentage. I am using Qlik Sense and dont see an option to add trendline.
- Mark as New
- Bookmark
- Subscribe
- Mute
- Subscribe to RSS Feed
- Permalink
- Report Inappropriate Content
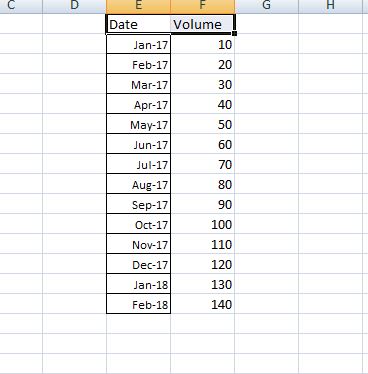
Sunny,
Below image shows my data structure. I want to see month on month cumulative growth as a percentage. How do I achieve this? I have data from Jan 2014 - July 2018.
- Mark as New
- Bookmark
- Subscribe
- Mute
- Subscribe to RSS Feed
- Permalink
- Report Inappropriate Content
So, feb-17 will have a bar for 20/10-1 = 100% and then Mar-17 will have a bar with 30/20 - 1 = 50% + 100% = 150%?
- Mark as New
- Bookmark
- Subscribe
- Mute
- Subscribe to RSS Feed
- Permalink
- Report Inappropriate Content
Hi Sunny,
My explanation was incorrect. What I am looking for is 2 things.
1) In a bar chart, I want month on month growth rate. That would be Jan 2018 over Jan 2017.
2) As a trend line in the same chart I want Year to Month Values growth. For example: Jan+Feb 2018 over Jan + Feb 2017, and so on. Below is an image with sample data in excel. Hope my explanation is clear. 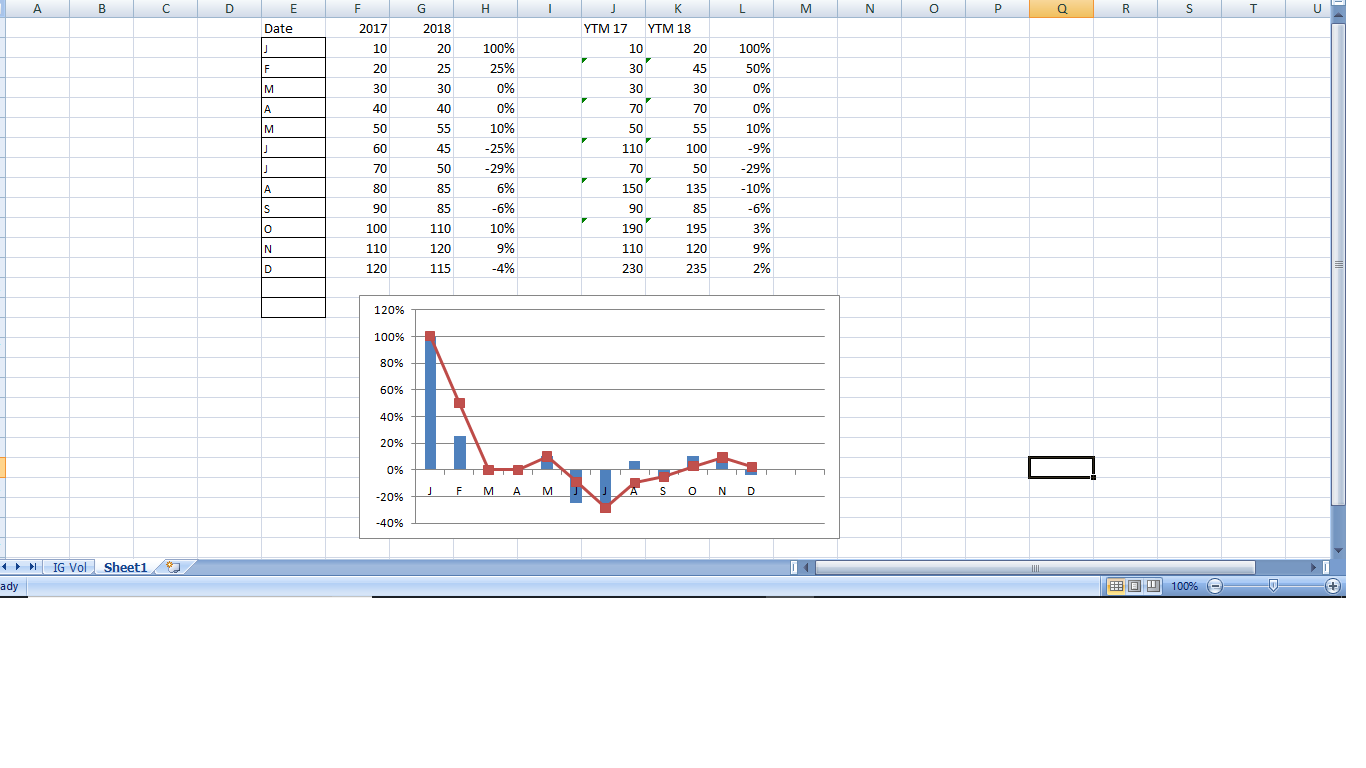
- « Previous Replies
- Next Replies »