Unlock a world of possibilities! Login now and discover the exclusive benefits awaiting you.
- Qlik Community
- :
- Forums
- :
- Analytics & AI
- :
- Products & Topics
- :
- Visualization and Usability
- :
- Re: Display dynamic grid based on Dimension field ...
- Subscribe to RSS Feed
- Mark Topic as New
- Mark Topic as Read
- Float this Topic for Current User
- Bookmark
- Subscribe
- Mute
- Printer Friendly Page
- Mark as New
- Bookmark
- Subscribe
- Mute
- Subscribe to RSS Feed
- Permalink
- Report Inappropriate Content
Display dynamic grid based on Dimension field Year/Month
Hi,
I'm wanting to know how to create 2 grids, first one from the filter dropdown for year/month and the second one should dynamically display Year-1/Month. pic and data file attached
in Tableau, I used a parameter filter and flags to calculate current value and calculated value for Year/month and Year-1/month.
Thanks in advance
Raj
Accepted Solutions
- Mark as New
- Bookmark
- Subscribe
- Mute
- Subscribe to RSS Feed
- Permalink
- Report Inappropriate Content
Like this?

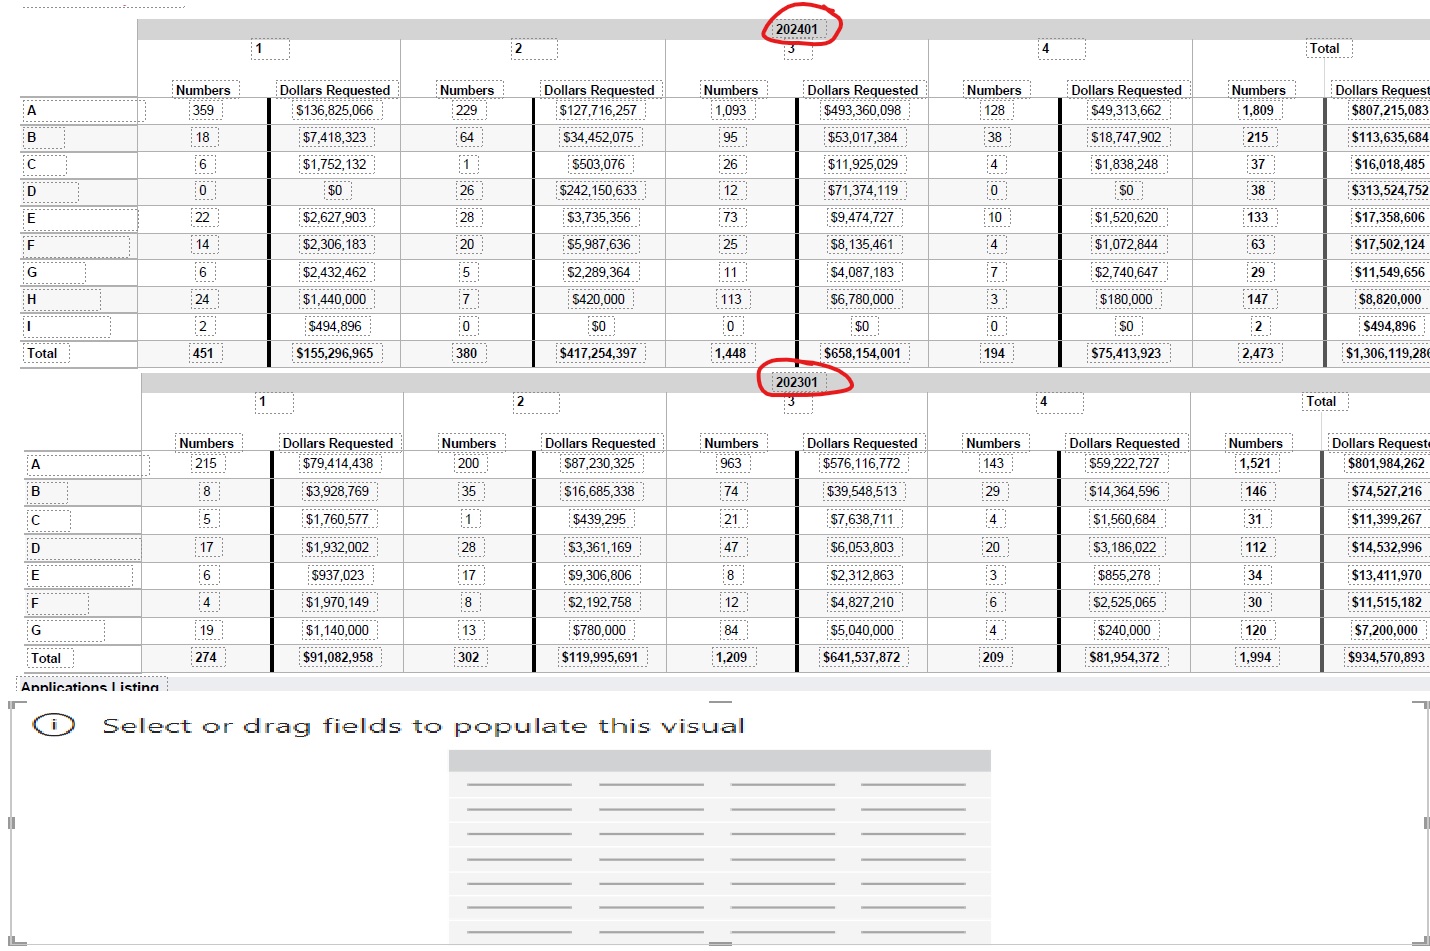
The two pivot tables are mostly identical. The top one shows values for the largest possible Date, while the bottom one shows values for the date 1 year prior to the largest possible date. Here are the expressions I've used for the titles:
=Max(Date)
=Date(AddYears(Max(Date),-1),'MMM YYYY')
You can find the same expressions as parts of the set analyses used for the measures in each chart:
{<Date={"$(=Max(Date))"}>}
{<Date={"$(=Date(AddYears(Max(Date),-1),'MMM YYYY'))"}>}
Apart from that the Measures are just using Sum() over the respective fields and are formatted as a number/currency.
In the script I loaded and transformed your data and added values for the Division 'Total'. Here is the full script:
Data:
NoConcatenate Load
	Category,
    Division,
    Date(Date#(Date, 'YYYYMM'), 'MMM YYYY') as Date,
    Numbers,
    Num#(Mid("Dollars Requested", 2), '#,##0') as "Dollars Requested";
Load
    Category,
    Division,
    Date,
    Numbers,
    "Dollars Requested"
From [lib://AttachedFiles/Summary dates and funding.csv]
(txt, utf8, embedded labels, delimiter is ',', msq);

Concatenate Load
    Category,
    Dual('Total', 99) as Division,	// I used 99 to make sure it would be last when sorting the Division Field
    Date,
    Sum(Numbers) as Numbers,
    Sum("Dollars Requested") as "Dollars Requested"
Resident Data
Group By Category, Date;
- Mark as New
- Bookmark
- Subscribe
- Mute
- Subscribe to RSS Feed
- Permalink
- Report Inappropriate Content
Like this?
The two pivot tables are mostly identical. The top one shows values for the largest possible Date, while the bottom one shows values for the date 1 year prior to the largest possible date. Here are the expressions I've used for the titles:
=Max(Date)
=Date(AddYears(Max(Date),-1),'MMM YYYY')
You can find the same expressions as parts of the set analyses used for the measures in each chart:
{<Date={"$(=Max(Date))"}>}
{<Date={"$(=Date(AddYears(Max(Date),-1),'MMM YYYY'))"}>}
Apart from that the Measures are just using Sum() over the respective fields and are formatted as a number/currency.
In the script I loaded and transformed your data and added values for the Division 'Total'. Here is the full script:
Data:
NoConcatenate Load
	Category,
    Division,
    Date(Date#(Date, 'YYYYMM'), 'MMM YYYY') as Date,
    Numbers,
    Num#(Mid("Dollars Requested", 2), '#,##0') as "Dollars Requested";
Load
    Category,
    Division,
    Date,
    Numbers,
    "Dollars Requested"
From [lib://AttachedFiles/Summary dates and funding.csv]
(txt, utf8, embedded labels, delimiter is ',', msq);

Concatenate Load
    Category,
    Dual('Total', 99) as Division,	// I used 99 to make sure it would be last when sorting the Division Field
    Date,
    Sum(Numbers) as Numbers,
    Sum("Dollars Requested") as "Dollars Requested"
Resident Data
Group By Category, Date;
- Mark as New
- Bookmark
- Subscribe
- Mute
- Subscribe to RSS Feed
- Permalink
- Report Inappropriate Content
Thank you for this solution. Is it possible to keep the Date as a string and do manipulations on it?
- Mark as New
- Bookmark
- Subscribe
- Mute
- Subscribe to RSS Feed
- Permalink
- Report Inappropriate Content
It is certainly possible. But working with dates as strings just sucks. You can't use maths or smaller/greater comparisons but rather have to directly check for every e.g. month individually.
You could keep dates as integers in a "YYYYMMDD" format. This way adding or subtracting full years is relatively simple. Working with months, weeks or days is a bit more complicated however.
I don't see a reason not to format a date as such. You have access to all date functions and can choose the string representation of the date with a date format string.
- Mark as New
- Bookmark
- Subscribe
- Mute
- Subscribe to RSS Feed
- Permalink
- Report Inappropriate Content
Hello, can I use a list filter to show the dates and let the user choose the Year/Month and then display the current year/month and previous year/month numbers to display dynamically instead of using the max(date) function?
Thank you for your responses thus far
- Mark as New
- Bookmark
- Subscribe
- Mute
- Subscribe to RSS Feed
- Permalink
- Report Inappropriate Content
When you make a selection on the Data, the most recent/current date of your selection can be found using the Max(Date) function. The result adjusts dynamically to your selections.