Unlock a world of possibilities! Login now and discover the exclusive benefits awaiting you.

- Qlik Community
- :
- Forums
- :
- Analytics & AI
- :
- Products & Topics
- :
- Visualization and Usability
- :
- Re: Dynamic date
- Subscribe to RSS Feed
- Mark Topic as New
- Mark Topic as Read
- Float this Topic for Current User
- Bookmark
- Subscribe
- Mute
- Printer Friendly Page

 JRamos
- Mark as New
- Bookmark
- Subscribe
- Mute
- Subscribe to RSS Feed
- Permalink
- Report Inappropriate Content
Dynamic date
Hi all,
I'm just moving to QlikSense from Tableau but I need to create a "dynamic date/parameter date", I'm using my date like a filter but I need to show the data from the last date of my date filter selection for only one of my columns, for example:
Date Filter The one column All the other data
09/28/21 09/27/21 09/28/21
09/29/21 09/28/21 09/29/21
09/30/21 09/29/21 09/30/21
Is that possible? Could you support me?
Regards!!!
- « Previous Replies
-
- 1
- 2
- Next Replies »
Accepted Solutions

 stevejoyce
- Mark as New
- Bookmark
- Subscribe
- Mute
- Subscribe to RSS Feed
- Permalink
- Report Inappropriate Content
Go into edit mode. click on the chart. and look at the dimensions / measures on the right side.
In all your measures in that chart, add that set analysis to it.
lets say right now you have sum( sales). update it to sum( {< [My date filter] = {'$(=date(max([My date filter]) - 1)'} >} sales.
stevejoyce
- Mark as New
- Bookmark
- Subscribe
- Mute
- Subscribe to RSS Feed
- Permalink
- Report Inappropriate Content
You can create a 2nd field to be used as a date filter on front-end which is date([Data to show] + 1), where "Data to show" is associated to rest of your data model.
date_table:
load
*
,date([Data to show] + 1) as [Date Filter]
JRamos
- Mark as New
- Bookmark
- Subscribe
- Mute
- Subscribe to RSS Feed
- Permalink
- Report Inappropriate Content
Hi @stevejoyce ,
What about if I only want to affect only one column of data? All the other information needs to shows the data of my current date filter, like:
Date Filter One column All the other data
09/28/21 09/27/21 09/28/21
09/29/21 09/28/21 09/29/21
09/30/21 09/29/21 09/30/21
Regards!
stevejoyce
- Mark as New
- Bookmark
- Subscribe
- Mute
- Subscribe to RSS Feed
- Permalink
- Report Inappropriate Content
I don't follow.
let's say you have a date dimension table, joining to fact data. You want the user to select 9/28 but it filters to 9/27 data?
You'd have " [One column] " joined to rest of your data model (fact table) but [Date Filter] would be a filter object in your app.
Can you expand from here...
JRamos
- Mark as New
- Bookmark
- Subscribe
- Mute
- Subscribe to RSS Feed
- Permalink
- Report Inappropriate Content
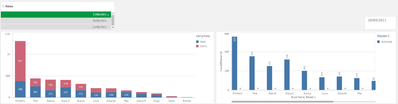
Yeah, I have a date dimension column in my data, the user needs to select a date (9/27) and all the information will filter to (9/27) and it's ok, but one dimension column needs to show me the information from (9/26):
Rdate: My date filter (09/27)
Bar left: Showing the data from (09/27), its ok
Bar Right: Showing the data from (09/27) because my filter but needs to show the data from (09/26)
stevejoyce
- Mark as New
- Bookmark
- Subscribe
- Mute
- Subscribe to RSS Feed
- Permalink
- Report Inappropriate Content
Ok so this would be handled in the set analysis of your expression.
Not sure if you are expecting the user to select 1 value to be able to display this chart, if so you'd do it like this:
sum({<[My date filter] = {'$(=date(max([My date filter]) - 1)'} >} value)
JRamos
- Mark as New
- Bookmark
- Subscribe
- Mute
- Subscribe to RSS Feed
- Permalink
- Report Inappropriate Content
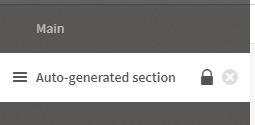
Sorry for my delay, I'm new using QlikSense, do I need to write the expression in the main or in the Auto-generated section? I will try to test it
stevejoyce
- Mark as New
- Bookmark
- Subscribe
- Mute
- Subscribe to RSS Feed
- Permalink
- Report Inappropriate Content
My last post was referring to the expressions in your chart.
Your right chart can be updated to include this set analysis:
[My date filter] = {'$(=date(max([My date filter]) - 1)'}
JRamos
- Mark as New
- Bookmark
- Subscribe
- Mute
- Subscribe to RSS Feed
- Permalink
- Report Inappropriate Content
Yes, that's what my right chart needs to do, but I don't know how to update or write a expression to do that
stevejoyce
- Mark as New
- Bookmark
- Subscribe
- Mute
- Subscribe to RSS Feed
- Permalink
- Report Inappropriate Content
Go into edit mode. click on the chart. and look at the dimensions / measures on the right side.
In all your measures in that chart, add that set analysis to it.
lets say right now you have sum( sales). update it to sum( {< [My date filter] = {'$(=date(max([My date filter]) - 1)'} >} sales.

- « Previous Replies
-
- 1
- 2
- Next Replies »