Unlock a world of possibilities! Login now and discover the exclusive benefits awaiting you.
- Qlik Community
- :
- Forums
- :
- Analytics & AI
- :
- Products & Topics
- :
- Visualization and Usability
- :
- Re: How can I modify the range of x-axis
- Subscribe to RSS Feed
- Mark Topic as New
- Mark Topic as Read
- Float this Topic for Current User
- Bookmark
- Subscribe
- Mute
- Printer Friendly Page
- Mark as New
- Bookmark
- Subscribe
- Mute
- Subscribe to RSS Feed
- Permalink
- Report Inappropriate Content
How can I modify the range of x-axis
Hi All,
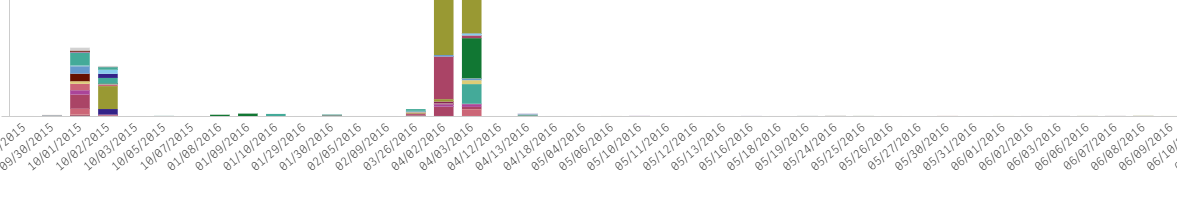
I am new to qlik sense and need your help. Can you please suggest how can I modify the range of x-axis. Now here as shown in below screen shot the dates are shown in x-axis. Now I want to see the data for the latest date.
- Mark as New
- Bookmark
- Subscribe
- Mute
- Subscribe to RSS Feed
- Permalink
- Report Inappropriate Content
I'm afraid it can't be done in Qlik Sense,
Here's more details :
Regards, Marcel.
- Mark as New
- Bookmark
- Subscribe
- Mute
- Subscribe to RSS Feed
- Permalink
- Report Inappropriate Content
sure it is possible:
use set analysis to "limit" measure values to certain values of dimensions !
Set Analysis: syntaxes, examples
so something like sum({<Date={"$(=max(Date))"}>}Sales) for only the latest date value
or more fun with sum({<Date={">=$(=max(Date))-42"}>}Sales) to get only measure values for dates >= max date - 42
- Mark as New
- Bookmark
- Subscribe
- Mute
- Subscribe to RSS Feed
- Permalink
- Report Inappropriate Content
Thanks for your response but can you please guide me where I have to configure set analysis to define dates for which I want data.
- Mark as New
- Bookmark
- Subscribe
- Mute
- Subscribe to RSS Feed
- Permalink
- Report Inappropriate Content
Hi, by looking into this it can be spotted that single date is coming multiple times on X-Axis which is due to timestamp values. You can use Dayname(Dimension_name) at the script level to remove the timestamp... then you can have a single value for each day.
coming back to your question, you can define the variable at script level or at report level by going to variable box which is available at extreme left bottom on the screen..
You can define the variable to get the current date
& which you can pass an input to the expression as suggested by Mikael. 
Hope this helps. Cheers
Rahul