Unlock a world of possibilities! Login now and discover the exclusive benefits awaiting you.
- Qlik Community
- :
- Forums
- :
- Analytics & AI
- :
- Products & Topics
- :
- Visualization and Usability
- :
- How to make time slabs in Qlik sense desktop
- Subscribe to RSS Feed
- Mark Topic as New
- Mark Topic as Read
- Float this Topic for Current User
- Bookmark
- Subscribe
- Mute
- Printer Friendly Page
- Mark as New
- Bookmark
- Subscribe
- Mute
- Subscribe to RSS Feed
- Permalink
- Report Inappropriate Content
How to make time slabs in Qlik sense desktop
Hi everyone,
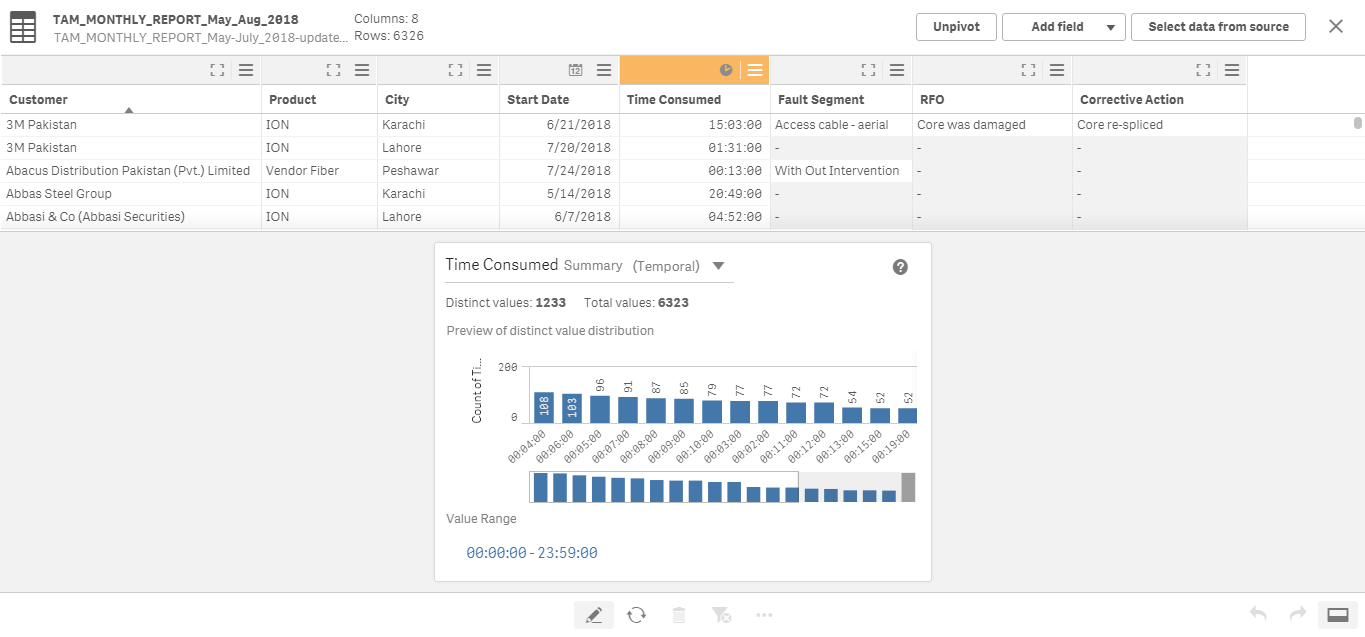
I am new to Data analytics and recently started using Qlik Sense Desktop. I have a data regarding faults in which I have got Time consumed for a fault to be resolved or MTTR. All I want to do is to convert that time to defined time slabs as follows:
1st bracket / slab <= 4 hrs.
2nd bracket / slab > 4 hrs. and <= 8 hrs
3rd bracket / slab > 8 hrs and <= 12 hrs.
4th bracket / slab > 12 and <= 16 hrs.
5th bracket / slab > 16 hrs.
I have converted the column to Time stamp with format of hh:mm:ss but the brackets option is not visible here.
Would really thankful for your support 
- Mark as New
- Bookmark
- Subscribe
- Mute
- Subscribe to RSS Feed
- Permalink
- Report Inappropriate Content
Hi,
you could try something like this to get your bucket number :
if(hour(your time field)/4 <4, hour(your time field)/4 + 1, 5)
regards
- Mark as New
- Bookmark
- Subscribe
- Mute
- Subscribe to RSS Feed
- Permalink
- Report Inappropriate Content
Hi,
there would be helpfull class() function https://help.qlik.com/en-US/sense/June2018/Subsystems/Hub/Content/Scripting/ConditionalFunctions/cla...
If not than you have to use if condition. It will look like this
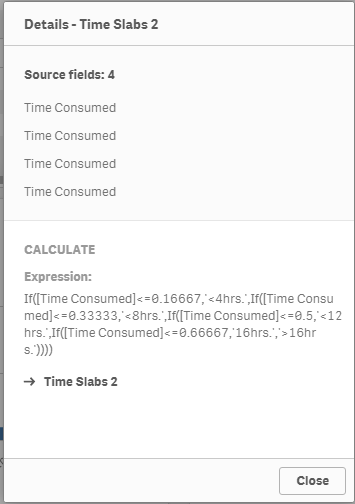
If([Time Consumed]<=0.16667,'First bracket',
If([Time Consumed]<=0.33333,'Second bracket',
If([Time Consumed]<=0.5,'Third bracket',
If([Time Consumed]<=0.66667,'Fourth bracket','Fifth bracket')))) as "Time Slabs"
- Mark as New
- Bookmark
- Subscribe
- Mute
- Subscribe to RSS Feed
- Permalink
- Report Inappropriate Content
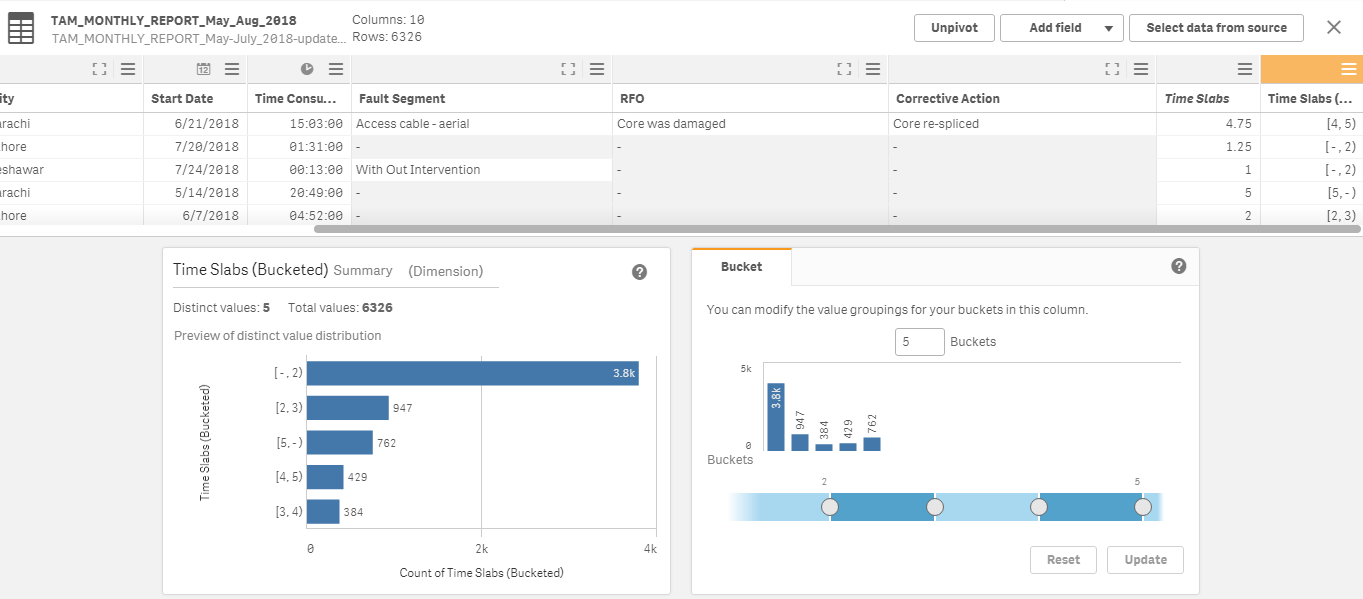
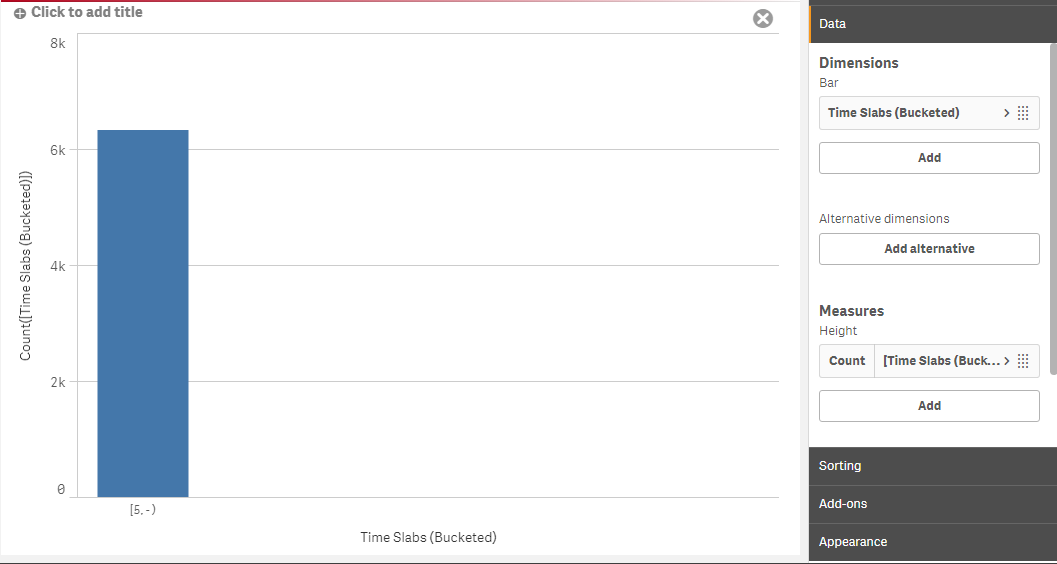
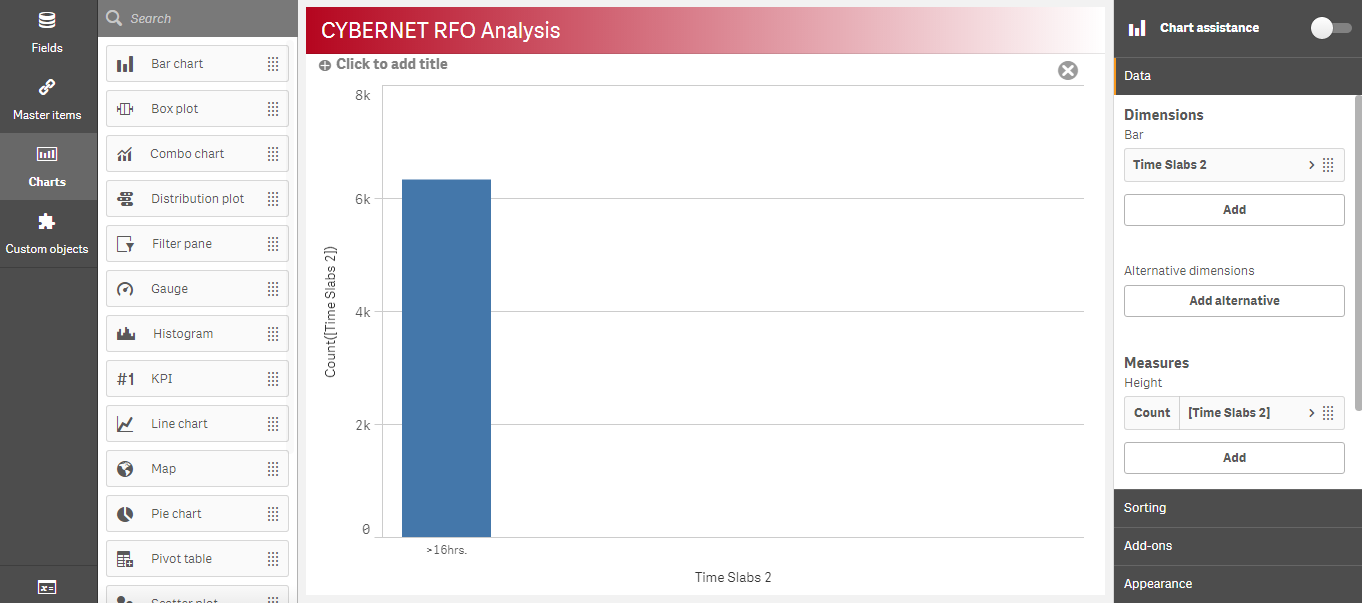
Thanks for the reply Olivier. I used your formula and successfully made the table and bucketed it but when I upload this data and make the graph out of it, then only the values of highest bucket is available. Please support
- Mark as New
- Bookmark
- Subscribe
- Mute
- Subscribe to RSS Feed
- Permalink
- Report Inappropriate Content
Hello David,
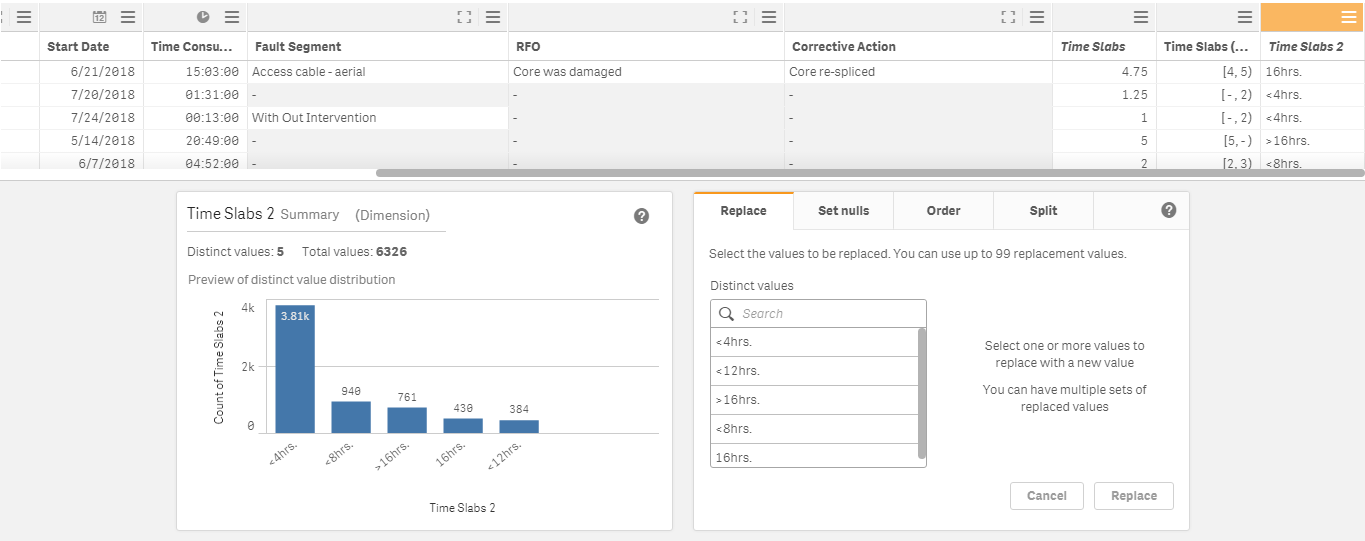
Thanks for response, I used your expression and was able to achieve the required result in Data Manager tab and the chart was also correctly visible but when I tried to make a Bar chart in my sheet, only the highest bracket was visible there.
- Mark as New
- Bookmark
- Subscribe
- Mute
- Subscribe to RSS Feed
- Permalink
- Report Inappropriate Content
Look at using the Class() Function as a Calculated Dimension:
e.g. Class([Time Consumed],4,'Time Consumed')
It can be combined with the IF() function like above if you specifically want to limit it to the first 16 hours
- Mark as New
- Bookmark
- Subscribe
- Mute
- Subscribe to RSS Feed
- Permalink
- Report Inappropriate Content
Hi,
it is strange. Could you provide sample of your data? Is there any filter applyed?