Unlock a world of possibilities! Login now and discover the exclusive benefits awaiting you.

- Qlik Community
- :
- Forums
- :
- Analytics & AI
- :
- Products & Topics
- :
- Visualization and Usability
- :
- Re: How to restrict zeros in bar chart?
Options
- Subscribe to RSS Feed
- Mark Topic as New
- Mark Topic as Read
- Float this Topic for Current User
- Bookmark
- Subscribe
- Mute
- Printer Friendly Page
Turn on suggestions
Auto-suggest helps you quickly narrow down your search results by suggesting possible matches as you type.
Showing results for

Anonymous
Not applicable
2017-01-03
03:10 PM
- Mark as New
- Bookmark
- Subscribe
- Mute
- Subscribe to RSS Feed
- Permalink
- Report Inappropriate Content
How to restrict zeros in bar chart?
Hi all,
I have a bar chart which displays around 1000000 zeros before actual values are displayed. I just wanted bottom 20 values in bar chart . How can I do this?
I have DSI as a measure and contains negative and positive values in it.(after summing DSI from each condition , I want to remove zeros from below expression
if(GetSelectedCount([Month])=0 and GetSelectedCount([Fiscal Year])=0,
num(sum({<report_metric_key={'4'}>}DSI),'#,##0'),
num(sum({<calendar_year_month = {'$(=Max(calendar_year_month))'}, report_metric_key={'4'}>}DSI),'#,##0')
)
Thanks
Juna
921 Views
1 Reply

 yasmeenk
Partner - Creator
2017-01-04
12:14 AM
- Mark as New
- Bookmark
- Subscribe
- Mute
- Subscribe to RSS Feed
- Permalink
- Report Inappropriate Content
Hi Sharma,
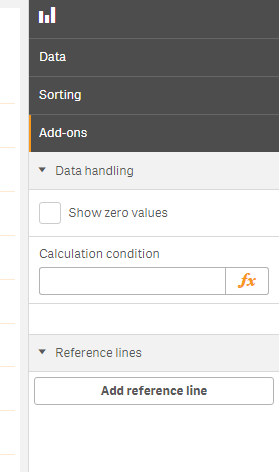
Try to uncheck the "Show Zero values" from Data Handling Option