Unlock a world of possibilities! Login now and discover the exclusive benefits awaiting you.
- Qlik Community
- :
- Forums
- :
- Analytics & AI
- :
- Products & Topics
- :
- Visualization and Usability
- :
- Maps in qlik sense
- Subscribe to RSS Feed
- Mark Topic as New
- Mark Topic as Read
- Float this Topic for Current User
- Bookmark
- Subscribe
- Mute
- Printer Friendly Page
- Mark as New
- Bookmark
- Subscribe
- Mute
- Subscribe to RSS Feed
- Permalink
- Report Inappropriate Content
Maps in qlik sense
Good morning
I m learning about use of Maps in qlik sense.
I load simple data with this code:
[Mapdata]:
Load
[Company] AS c,
CountryName,
CountryCode,
Number,
Latitude,
Longitude,
GeoMakePoint(Latitude,Longitude) as Location
FROM [lib://../MapsDataTest.xlsx]
(ooxml, embedded labels, table is Sheet1)
;
Trace ***** SkriptEnde *****;
Exit Script;
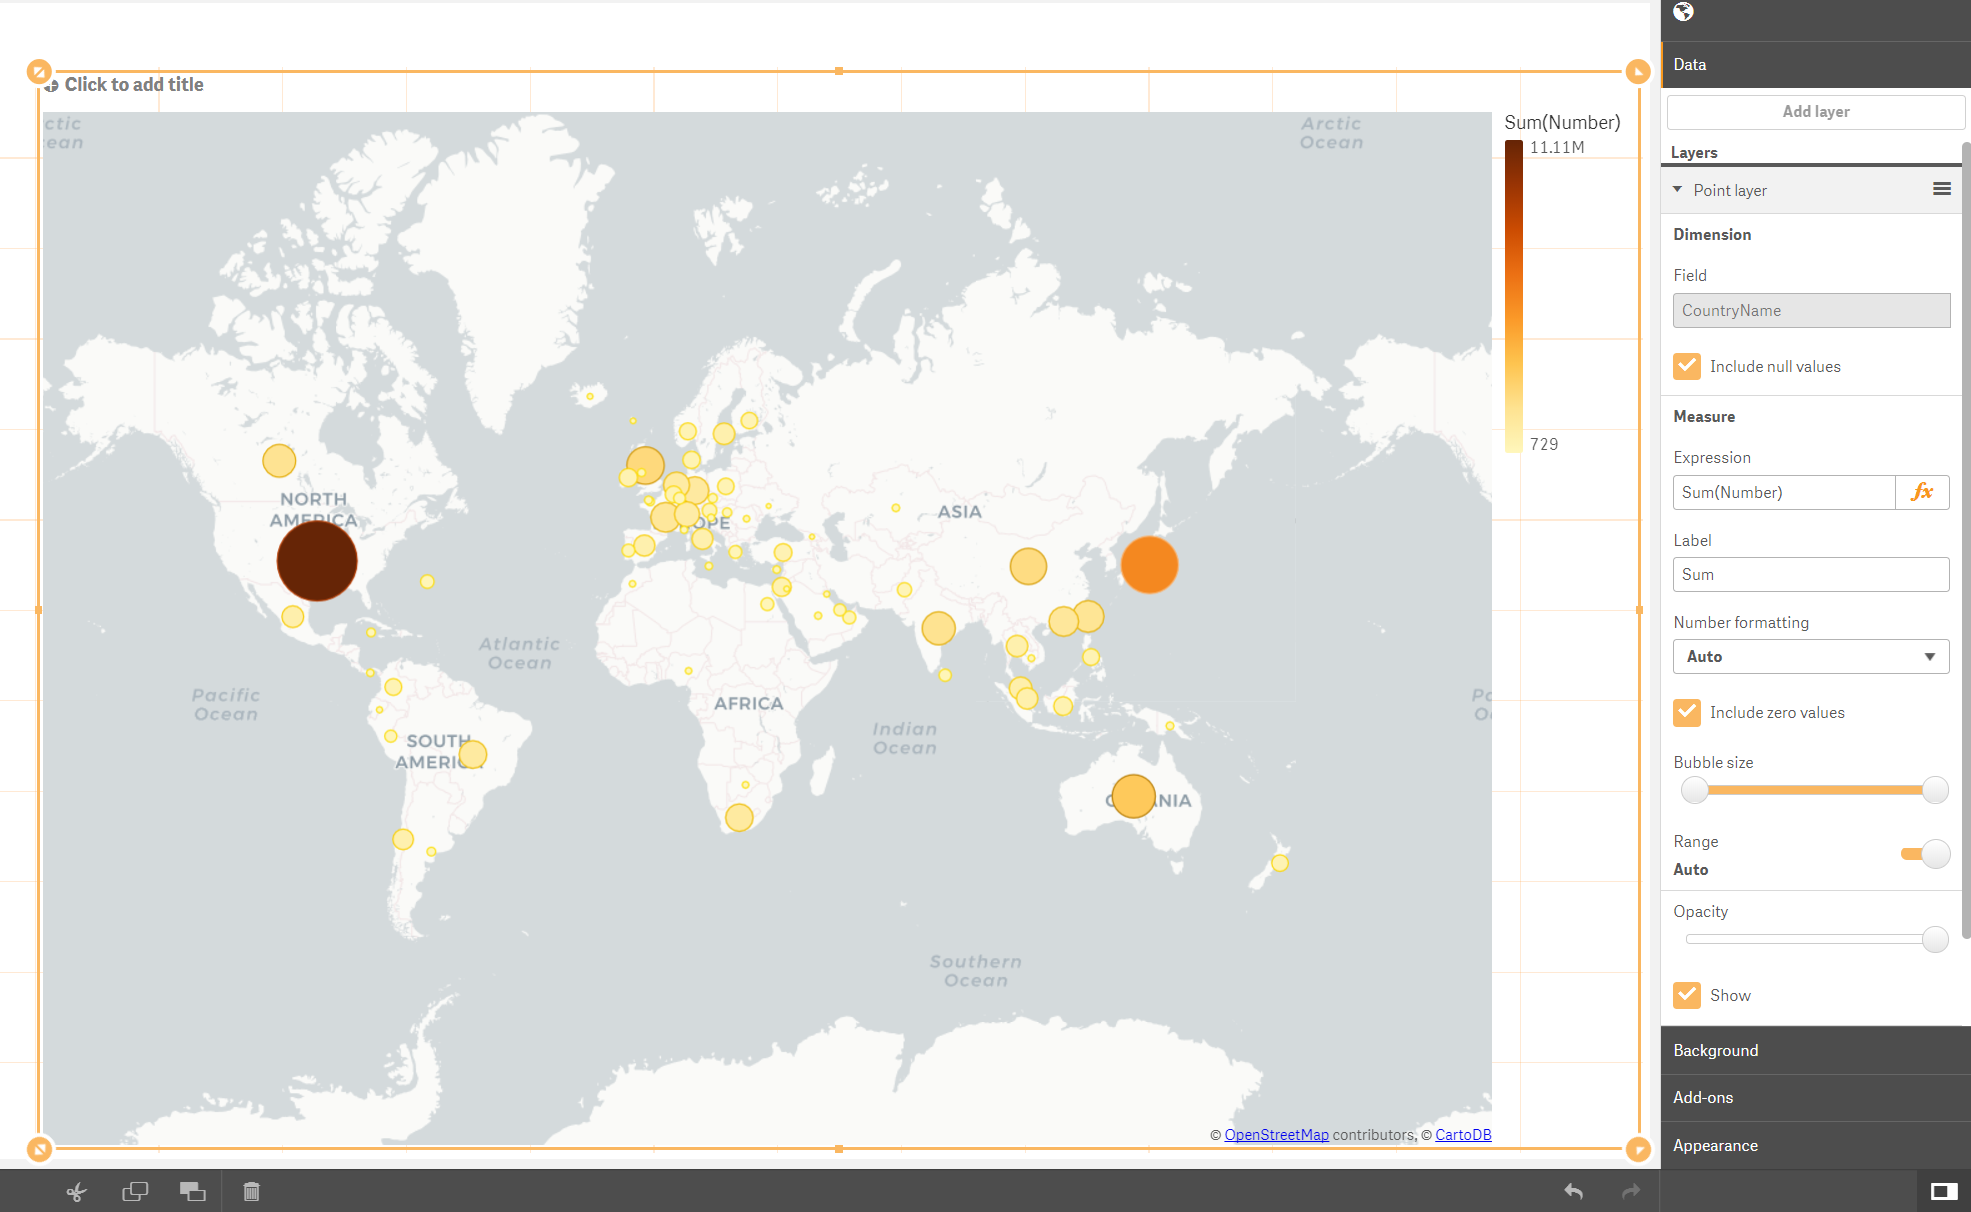
Now of course the result that I have is with Point but I would have different color for the country based on the sum(Numner). see the picture attached.
I have maybe to load the data in different way, someone have a suggestion?
Thanks for any helps
Accepted Solutions
- Mark as New
- Bookmark
- Subscribe
- Mute
- Subscribe to RSS Feed
- Permalink
- Report Inappropriate Content
Hi,
First thing you should know: you can't use points and areas (what you're trying to color) on the same map.
Latitude and longitude with Geomakepoints() ==> points on Map
KML file ==> Areas that you can color using an expression for example.
here is one document dedicated to maps on qliksense: Geographic 'Drill Down' (Areas and Points) for US MAP
take a look
- Mark as New
- Bookmark
- Subscribe
- Mute
- Subscribe to RSS Feed
- Permalink
- Report Inappropriate Content
I suggest you to take a look at Qlik Sense Mapping and County KML
Follow me on my LinkedIn | Know Gamma Informatica at gammainformatica.it
- Mark as New
- Bookmark
- Subscribe
- Mute
- Subscribe to RSS Feed
- Permalink
- Report Inappropriate Content
Hi,
First thing you should know: you can't use points and areas (what you're trying to color) on the same map.
Latitude and longitude with Geomakepoints() ==> points on Map
KML file ==> Areas that you can color using an expression for example.
here is one document dedicated to maps on qliksense: Geographic 'Drill Down' (Areas and Points) for US MAP
take a look