Unlock a world of possibilities! Login now and discover the exclusive benefits awaiting you.

- Qlik Community
- :
- Forums
- :
- Analytics & AI
- :
- Products & Topics
- :
- Visualization and Usability
- :
- Re: Waterfal Chart Y-Axis
- Subscribe to RSS Feed
- Mark Topic as New
- Mark Topic as Read
- Float this Topic for Current User
- Bookmark
- Subscribe
- Mute
- Printer Friendly Page

 livio218526
- Mark as New
- Bookmark
- Subscribe
- Mute
- Subscribe to RSS Feed
- Permalink
- Report Inappropriate Content
Waterfal Chart Y-Axis
Hello to all,
I have some variables that I have defined as measures and that go to populate the graph as shown.
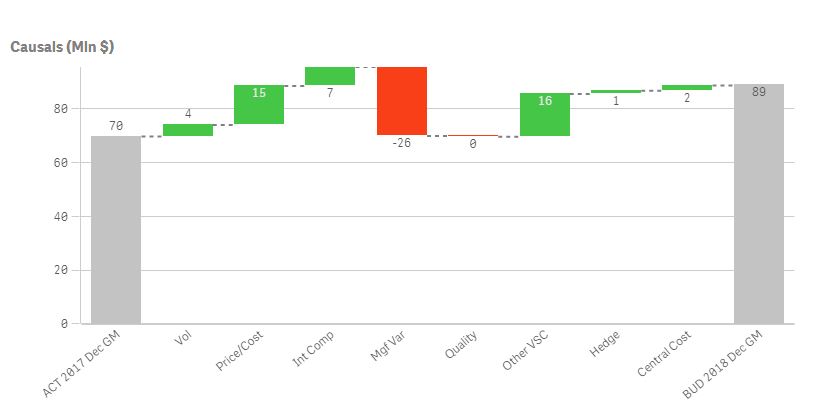
I need to set a dynamic range for the y axis, that is: in the case in the figure, the minimum value is 70 and therefore I would like the minimum to be fixed, for example, at 70 - 10 = 60.
The same reasoning for the max one, setting it for example at 96 (maximum value reached) + 10.
Hello and thanks,
Livio

 niclaz79
- Mark as New
- Bookmark
- Subscribe
- Mute
- Subscribe to RSS Feed
- Permalink
- Report Inappropriate Content
Hi,
Try below, using your expression and aggregating over your x-axis dimension to find the lowest number and then removing 10. Put the expression in your min value for y-axis.
Min(Aggr($(vMyExpression),x-axis))-10
livio218526
- Mark as New
- Bookmark
- Subscribe
- Mute
- Subscribe to RSS Feed
- Permalink
- Report Inappropriate Content
Sorry,
i don't understand.
I have multiple variable:
=Min(Aggr($(vVolumes)+$(vInterestCompensation)+$(vMfgVar)+$(vQuality)+$(vOthVSC)+$(vHedge)+$(vCentralCost),x-axis))-10
but i don't understand x-axis value
niclaz79
- Mark as New
- Bookmark
- Subscribe
- Mute
- Subscribe to RSS Feed
- Permalink
- Report Inappropriate Content
Hi,
You have to replace x-axis with your actual dimension.

 Digvijay_Singh
- Mark as New
- Bookmark
- Subscribe
- Mute
- Subscribe to RSS Feed
- Permalink
- Report Inappropriate Content
AFAIK Waterfall chart doesn't support dimension, supports only measures. I think Livio is asking he has 10 expressions and he is trying to get minimum of these 10 expressions and wants to put that minimum in min value of Y axis.
Digvijay_Singh
- Mark as New
- Bookmark
- Subscribe
- Mute
- Subscribe to RSS Feed
- Permalink
- Report Inappropriate Content
I think you may need to use rangemin and rangemax like that -
Rangemin(Expression1,Expression2,Expression3....)-10 for lowest value
and Rangemax(Expression1,Expression2,Expression3..)+10 for highest value
in min and max range expression of Y-value.
niclaz79
- Mark as New
- Bookmark
- Subscribe
- Mute
- Subscribe to RSS Feed
- Permalink
- Report Inappropriate Content
This would give him a min of -26 though which would make the graph even worse than it is.
Digvijay_Singh
- Mark as New
- Bookmark
- Subscribe
- Mute
- Subscribe to RSS Feed
- Permalink
- Report Inappropriate Content
You are right, I think if he can only include bars expressions inside rangemin/max, that may work, not sure though
