Unlock a world of possibilities! Login now and discover the exclusive benefits awaiting you.
- Qlik Community
- :
- Forums
- :
- Analytics & AI
- :
- Products & Topics
- :
- Visualization and Usability
- :
- Sorting inner segments of Stacked Bar
- Subscribe to RSS Feed
- Mark Topic as New
- Mark Topic as Read
- Float this Topic for Current User
- Bookmark
- Subscribe
- Mute
- Printer Friendly Page
- Mark as New
- Bookmark
- Subscribe
- Mute
- Subscribe to RSS Feed
- Permalink
- Report Inappropriate Content
Sorting inner segments of Stacked Bar
Hi,
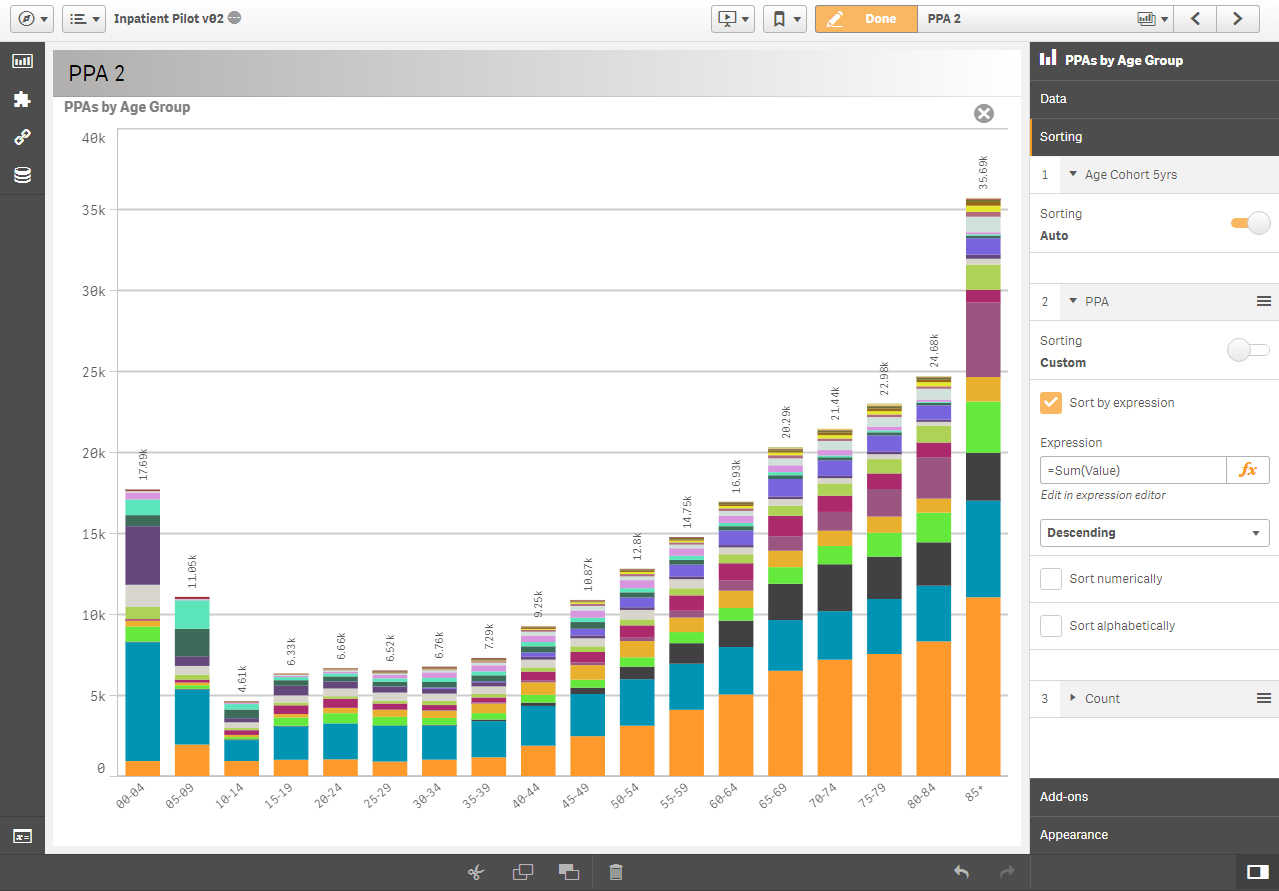
Can anyone please help me to sort the inner segments of each the stacked bar from the one with the most for each Age Group to the one with the least?
For example, for the Age Group 00-04, the blue segment should be at the bottom, then the purple, etc.
Maybe this is not possible and it's designed like that because all segments should have the same order?... I mean from the usability of the visualisation point of view...
Regards
Luis
Accepted Solutions
- Mark as New
- Bookmark
- Subscribe
- Mute
- Subscribe to RSS Feed
- Permalink
- Report Inappropriate Content
Found the solution,
I changed the way the second dimension (inside each bar) was created...
instead of just using :
PPA
I'm using:
=DUAL(PPA,AGGR(Sum(Value),PPA,age_cohort_5yrs_ch))
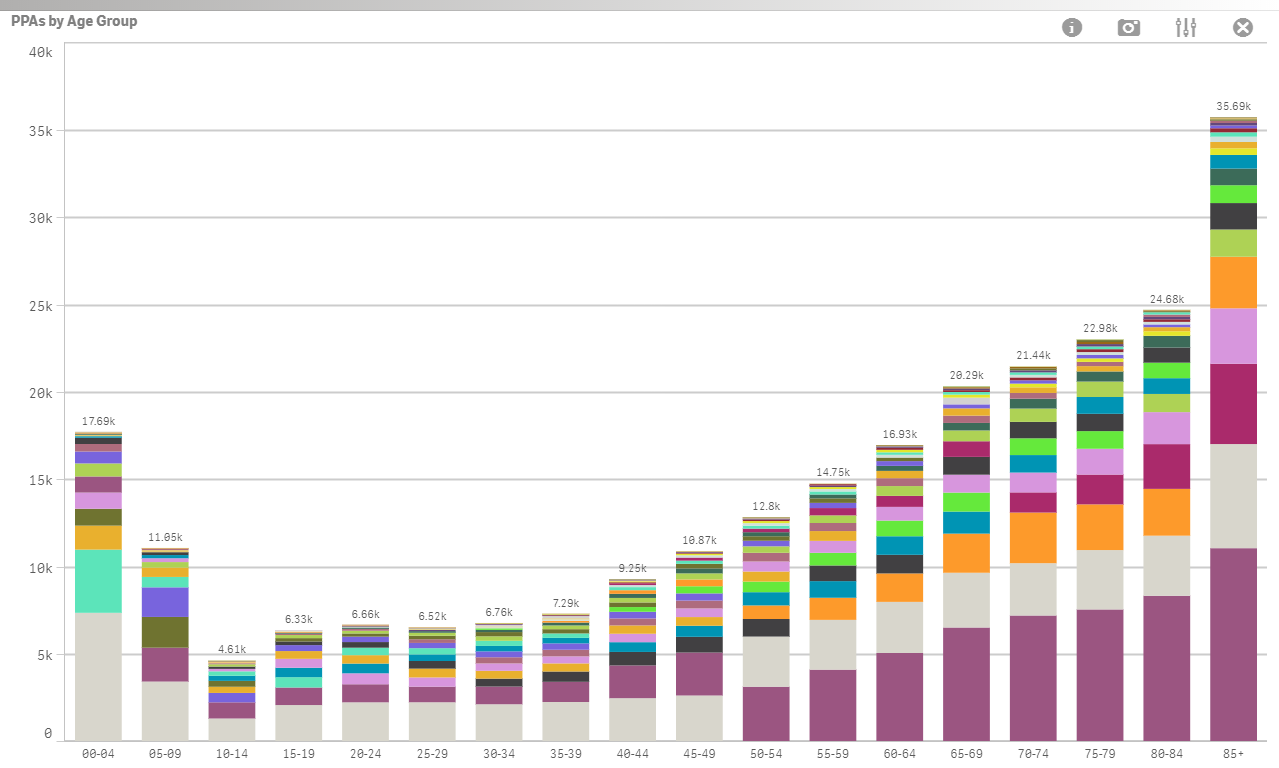
Then in the Sorting area, selected Numeric Descending. Now each inner segment of each bar is sorted as required 
I hope this helps someone else
Cheers,
Luis
- Mark as New
- Bookmark
- Subscribe
- Mute
- Subscribe to RSS Feed
- Permalink
- Report Inappropriate Content
I guess this may not be possible in Qlik Sense... Is this possible in Qlik View?
Please let me know,
Thanks,
Luis
- Mark as New
- Bookmark
- Subscribe
- Mute
- Subscribe to RSS Feed
- Permalink
- Report Inappropriate Content
Found the solution,
I changed the way the second dimension (inside each bar) was created...
instead of just using :
PPA
I'm using:
=DUAL(PPA,AGGR(Sum(Value),PPA,age_cohort_5yrs_ch))
Then in the Sorting area, selected Numeric Descending. Now each inner segment of each bar is sorted as required
I hope this helps someone else
Cheers,
Luis
- Mark as New
- Bookmark
- Subscribe
- Mute
- Subscribe to RSS Feed
- Permalink
- Report Inappropriate Content
Hello!
I am facing now the same task. I would like to use your solution, but I cannot figure out what is the PPA (second dimension?), Value and the age_cohort_5yrs_ch.
I have a base sorting by Date, and when it comes to the stacks, i would like the dayWorkRobotDuration[min] to be also sorrted, in a descending order (inside the stack).
Hope you can put a light on the namings you have been using,
Thanks in advance,
Imola

- Mark as New
- Bookmark
- Subscribe
- Mute
- Subscribe to RSS Feed
- Permalink
- Report Inappropriate Content
Hello Luis!
In fact, now I am having the stacks ordered as wanted, but the colors are not consistent for each Station. In one bar a certain station has one color, in an other another color. Is there a reason why?
I have defined the Station in the Data section as follows:
=DUAL(Station,AGGR(Sum([dayRobotWorkDuration[min]]]),Station,Date))
Hope someone can help.
Thank you,
Greets, Imola
- Mark as New
- Bookmark
- Subscribe
- Mute
- Subscribe to RSS Feed
- Permalink
- Report Inappropriate Content
Hi,
I was struggling with the same issue, I originally tried manually setting colours in the master dimension, but I found if you colour by dimension in the appearance settings of the chart, it will group all the common field values under one colour based on the text value in the dual() dimension:

- Mark as New
- Bookmark
- Subscribe
- Mute
- Subscribe to RSS Feed
- Permalink
- Report Inappropriate Content
Hi
Thanks for the reply! I see that the solution could solve the problem I had.
Somewhere in the meanwhile, i have decided to explore other BI tools for visualizing my analytical tables, and I found one much more convenient for me!
Cheers,
Im