Unlock a world of possibilities! Login now and discover the exclusive benefits awaiting you.
- Qlik Community
- :
- All Forums
- :
- QlikView App Dev
- :
- how to get last 6 months data
- Subscribe to RSS Feed
- Mark Topic as New
- Mark Topic as Read
- Float this Topic for Current User
- Bookmark
- Subscribe
- Mute
- Printer Friendly Page
- Mark as New
- Bookmark
- Subscribe
- Mute
- Subscribe to RSS Feed
- Permalink
- Report Inappropriate Content
how to get last 6 months data
Hello!
There is a table having 2 field one is sales field and another is date field. date field contain dates of 2011 and 2012 .
Maximum date is 16/02/2012 (dd/mm/yyyy). 2012 Feb is maximum.
The requirement is display sum of sales of last 6 month in a bar chart . It will show Feb,Jan,Dec,Nov,Oct and Sept months sum(sales).
Please help me to write a set analysis for this.
Thanks in advance.
- Mark as New
- Bookmark
- Subscribe
- Mute
- Subscribe to RSS Feed
- Permalink
- Report Inappropriate Content
May be look Set Analysis for Rolling Periods
- Mark as New
- Bookmark
- Subscribe
- Mute
- Subscribe to RSS Feed
- Permalink
- Report Inappropriate Content
Hello ,
Use following expression to display sum of sales of last 6 month
Sum({<Year=, Quarter=, Month=, Week=, Date={‘>=$(=MonthStart(Max(Date), -5))<=$(=Date(Max(Date)))’}>} Sales )
Regards,
Vikas
- Mark as New
- Bookmark
- Subscribe
- Mute
- Subscribe to RSS Feed
- Permalink
- Report Inappropriate Content
Hi,
You can use a set analysis expression to select the Date values of the last six months:
count({<Date={'>$(=AddMonths(Max(Date),-6))'}>} sales)
Thanks,
- Mark as New
- Bookmark
- Subscribe
- Mute
- Subscribe to RSS Feed
- Permalink
- Report Inappropriate Content
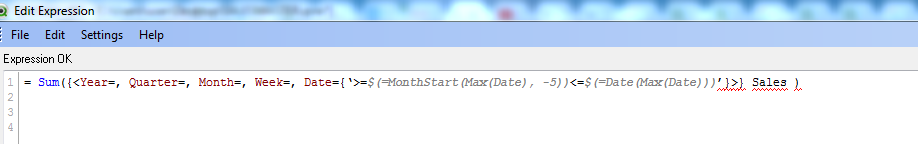 I tried it but that red line shows and not working.
- Mark as New
- Bookmark
- Subscribe
- Mute
- Subscribe to RSS Feed
- Permalink
- Report Inappropriate Content
Use following Expression
Sum({<Year=, Quarter=, Month=, Week=,Date={">=$(=MonthStart(Max(Date),-5)<=$(=Date(Max(Date)))"}>}Sales)