Unlock a world of possibilities! Login now and discover the exclusive benefits awaiting you.
- Qlik Community
- :
- All Forums
- :
- QlikView App Dev
- :
- above function
- Subscribe to RSS Feed
- Mark Topic as New
- Mark Topic as Read
- Float this Topic for Current User
- Bookmark
- Subscribe
- Mute
- Printer Friendly Page
- Mark as New
- Bookmark
- Subscribe
- Mute
- Subscribe to RSS Feed
- Permalink
- Report Inappropriate Content
above function
Hello everyone.
I have came accross with this problem.I have created a pivot table with daily,Month to date and Year to date quantity and net val per store.The user selects the date and the chart shows the quantity and net val for the selected day,month,year ,the quantity and net val for the same day last year and finally the comparisson between the 2 as shown in the picture below.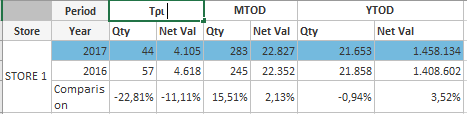
For the comparisson I have used the expression:
num((above(column(1),RowNo()-1)/above(column(1),RowNo()-2)-1)*100,'#.##0,00')&'%' for quantity and
num((above(column(2),RowNo()-1)/above(column(2),RowNo()-2)-1)*100,'#.##0,00')&'%' for net val.
When I have one store selected from the store's listobox seems to work fine.But when I select more than one stores(For the same selected date) in the comparisson row I get extreme values for just one of the selected stores as shown in the second picture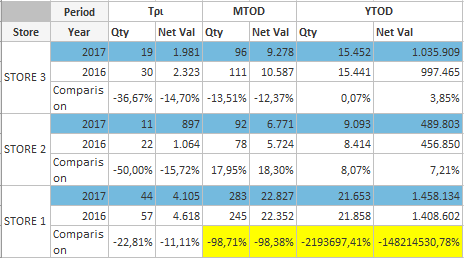
Can someone explain why this happens ?
Thank you in advance
- Mark as New
- Bookmark
- Subscribe
- Mute
- Subscribe to RSS Feed
- Permalink
- Report Inappropriate Content
Hi Kostis, I would try to split the expression and check the values to understand what is doing, setting the expressions just as:
- above(column(1),RowNo()-1)
- above(column(1),RowNo()-2)
Maybe it just needs a TOTAL qualifier:
above(TOTAL column(1)....
- Mark as New
- Bookmark
- Subscribe
- Mute
- Subscribe to RSS Feed
- Permalink
- Report Inappropriate Content
Hellon Ruben
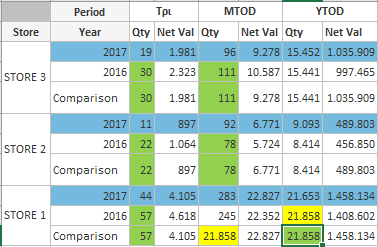
thanks for your answer.As you can see in the picture bellow I have tried your suggetion.
In the qty expression I used above(column(1),RowNo()-2) and
in the Net val expression I used above(column(2),RowNo()-1) just to see the results.
The net val expression returns always the cell for the 2017 year which is correct.
The quantity expression returns the 2016 cell which is correct except the MOTD column where it returns the 2016 cell but from the YTOD column.How this can be fixed?
The columns are give by a calculated dimension as : Pick(islandperiod,WeekDay(trn_date),'MTOD','YTOD')
where islandperdiod is loaded in the script with values 1,2,3
- Mark as New
- Bookmark
- Subscribe
- Mute
- Subscribe to RSS Feed
- Permalink
- Report Inappropriate Content
Strange that it only does this in one cell, is there a possibility to upload a sample that show the issue? It would be easier to make some test... I would test the value returned for just RowNo() and try to add the 'TOTAL' qualifier to see how it goes.