Unlock a world of possibilities! Login now and discover the exclusive benefits awaiting you.
- Qlik Community
- :
- All Forums
- :
- QlikView App Dev
- :
- Re: expanding time range in chart
- Subscribe to RSS Feed
- Mark Topic as New
- Mark Topic as Read
- Float this Topic for Current User
- Bookmark
- Subscribe
- Mute
- Printer Friendly Page
- Mark as New
- Bookmark
- Subscribe
- Mute
- Subscribe to RSS Feed
- Permalink
- Report Inappropriate Content
expanding time range in chart
Hi Qlikview experts,
I have data records with time interval of 5 minutes. I need to show a stacked line chart with time (e.g. time stamp) as dimension and number of distinct users as expression. This can be easily shown with a simple dimension and expression but I can only show the chart within limited time range (e.g. less than 24 hours). When I changed the interval to different value number of users is different, which might be additional distinct users added to this longer interval. As data is quite a lot it is uneasy to verify if this is a correct assumption, but the number does not seem to be in line with normal behavior and observation.
What is the way to show longer period in the chart but still maintain small interval so that the count distinct doesn't add up to unexpected numbers?
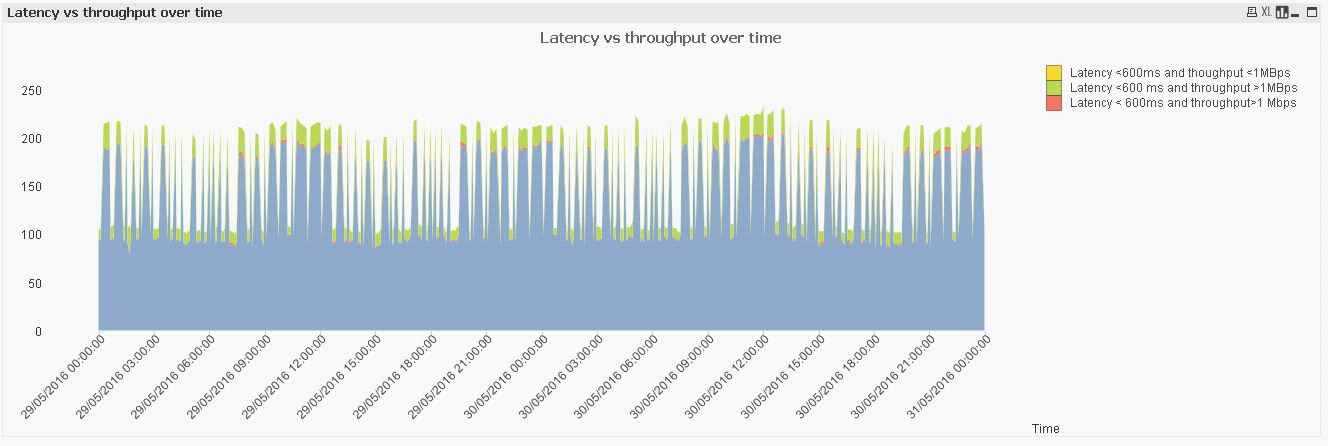
Here is the example of the chart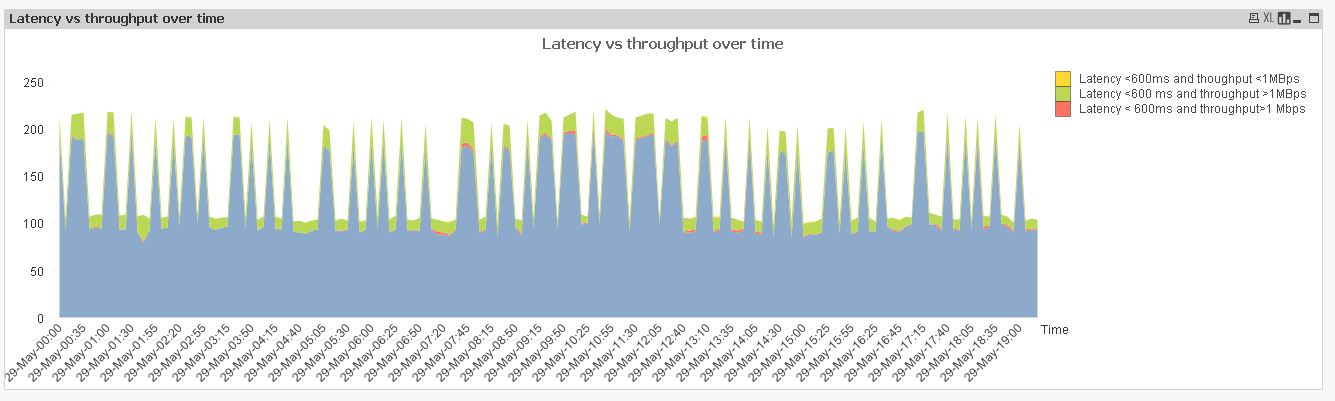
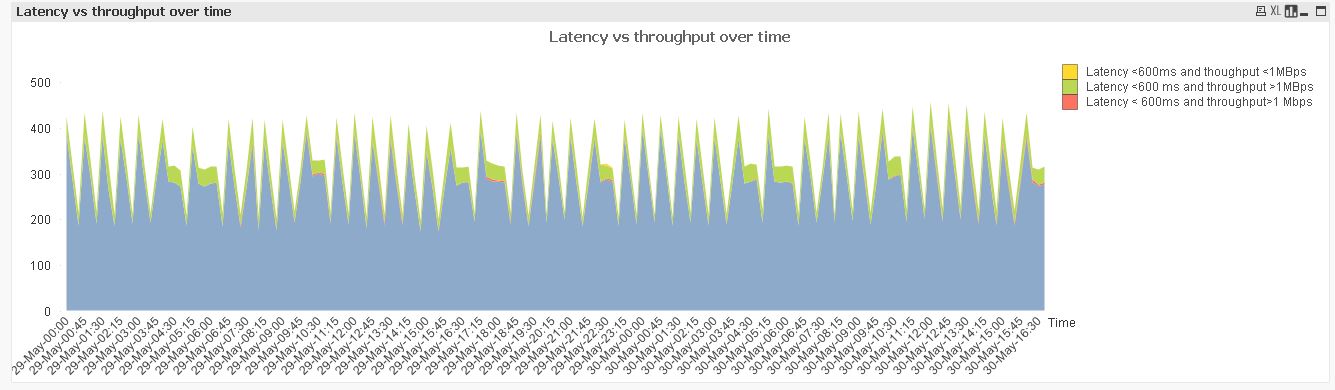
When interval is changed to show longer period in the chart this is what appears in the chart:
Still new to Qlikview, so any hint to this would be helpful.
- « Previous Replies
-
- 1
- 2
- Next Replies »
Accepted Solutions
- Mark as New
- Bookmark
- Subscribe
- Mute
- Subscribe to RSS Feed
- Permalink
- Report Inappropriate Content
glad it helped.
please close your thread if your initial question is answered.
Qlik Community Tip: Marking Replies as Correct or Helpful
thanks
regards
Marco
- Mark as New
- Bookmark
- Subscribe
- Mute
- Subscribe to RSS Feed
- Permalink
- Report Inappropriate Content
May be like this:
Sum(Aggr(Count(Distinct UserID), TimeStamp))
- Mark as New
- Bookmark
- Subscribe
- Mute
- Subscribe to RSS Feed
- Permalink
- Report Inappropriate Content
Hi,
I tried that expression but it seems now it is aggregating all numbers instead of keeping the number the same within that range. Besides, time range is not extended either unless I change the interval.
I still cannot show extended time range in the chart without changing the interval, but if I changed the interval to show longer time range the number with longer interval is summed, which I don't expect to see.
The intention here is to show longer time range without changing the 5 minutes time stamp interval.
- Mark as New
- Bookmark
- Subscribe
- Mute
- Subscribe to RSS Feed
- Permalink
- Report Inappropriate Content
How about this:
Sum(Aggr(Count(Distinct UserID), 5MinuteIntervalFieldHere))
- Mark as New
- Bookmark
- Subscribe
- Mute
- Subscribe to RSS Feed
- Permalink
- Report Inappropriate Content
Nothing showing up with that expression.
Attached is the example of the file I am using to test.
- Mark as New
- Bookmark
- Subscribe
- Mute
- Subscribe to RSS Feed
- Permalink
- Report Inappropriate Content
Can you try this as your dimension:
=Aggr(Dual(
( Time((Ceil([Time Stamp],1/IntervalSize)),'hh:mm')),
Ceil(Frac([Time Stamp]),1/IntervalSize)), [Time Stamp])
- Mark as New
- Bookmark
- Subscribe
- Mute
- Subscribe to RSS Feed
- Permalink
- Report Inappropriate Content
Hi,
Actually I have already used this similar expression, and tried with both Ceil and Foor .
=Aggr(Dual(
( Time((Ceil([Time Stamp],1/IntervalSize)),'hh:mm')),
Ceil(Frac([Time Stamp]),1/IntervalSize)), [Time Stamp])
It is OK to change the interval, but when I change the interval my chart us different. My intention is actually to keep the interval size at 5 min but would like to show longer period (e.g. 3 days or one week) instead of just merely a few hours on the x dimension. I think the above expression simply allows us to change the interval and round up the value to the nearest interval value)
I'd like to show the first chart above and keep the 5 in interval but showing longer range without using time slider on the X axis.
- Mark as New
- Bookmark
- Subscribe
- Mute
- Subscribe to RSS Feed
- Permalink
- Report Inappropriate Content
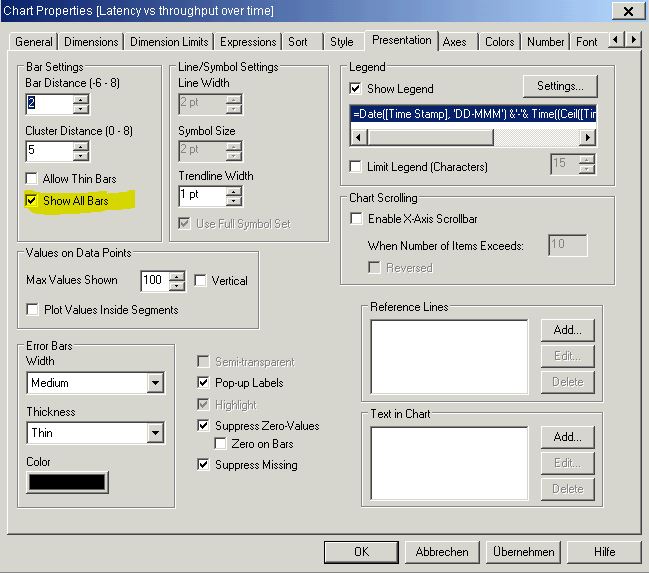
Hi,
one solution could be to use the "show all bars" option of the presentation tab.
(It will be available only after switching to bar chart type, but you can switch back to line chart after applying this setting.)
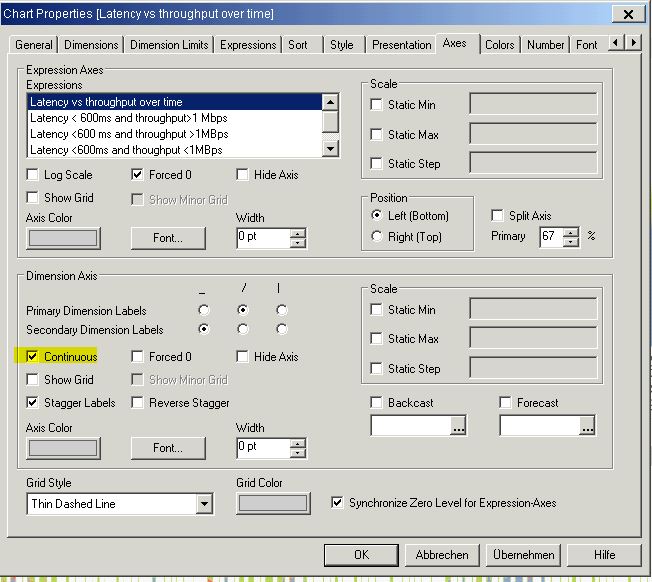
Another solution could be to use a continuous dimension axis.
You cannot use this option with your current calculated dimension as it delivers no numerical values, just text.
Changing your dimension to
=Timestamp((Ceil([Time Stamp],1/IntervalSize)),'DD-MMM-hh:mm')however will also deliver numerical values to use with continuous dimension axis:
hope this helps
regards
Marco
- Mark as New
- Bookmark
- Subscribe
- Mute
- Subscribe to RSS Feed
- Permalink
- Report Inappropriate Content
HI Marco,
Many Thanks for the tips. This works.
I learn something today.
- Mark as New
- Bookmark
- Subscribe
- Mute
- Subscribe to RSS Feed
- Permalink
- Report Inappropriate Content
glad it helped.
please close your thread if your initial question is answered.
Qlik Community Tip: Marking Replies as Correct or Helpful
thanks
regards
Marco
- « Previous Replies
-
- 1
- 2
- Next Replies »