- Mark as New
- Bookmark
- Subscribe
- Mute
- Subscribe to RSS Feed
- Permalink
- Report Inappropriate Content
rangesum with 2 dimensions
Good Day
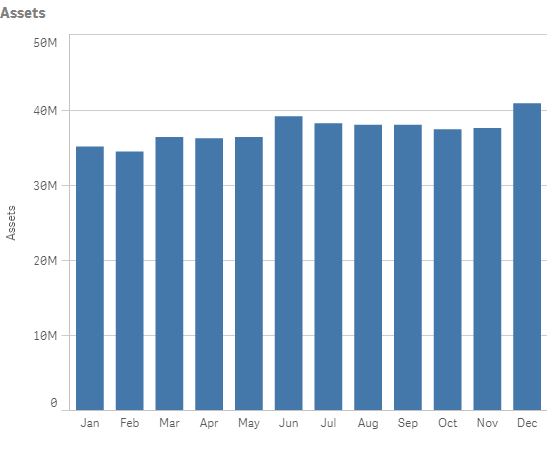
i am wondering why my formula is not working properly. i just want to show my data in asset by branch per month,
when i add the month as a dimension everything seems fine,
and this is my formula
=rangesum( above( Sum({<GLHeader= {1}>} GLTOTAL ),0,rowno()))
but when i add the banchname as dimension my data went wrong.
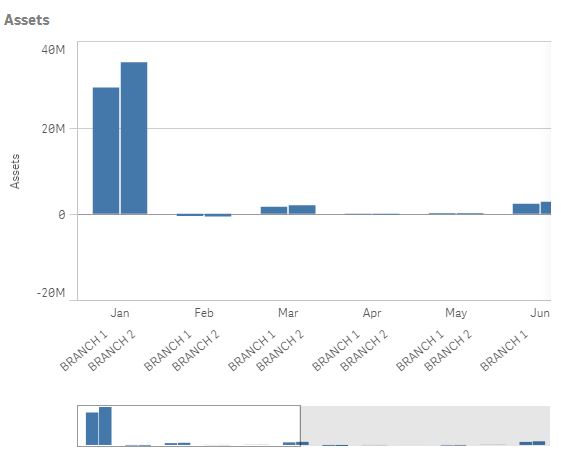
and i dont know why. can someone help me, any help will be appreciated
thanks
Accepted Solutions
- Mark as New
- Bookmark
- Subscribe
- Mute
- Subscribe to RSS Feed
- Permalink
- Report Inappropriate Content
May be this
=Aggr(RangeSum(Above(Sum({<GLHeader= {1}>} GLTOTAL), 0, RowNo())), Branch, Month)
- Mark as New
- Bookmark
- Subscribe
- Mute
- Subscribe to RSS Feed
- Permalink
- Report Inappropriate Content
May be this
=Aggr(RangeSum(Above(Sum({<GLHeader= {1}>} GLTOTAL), 0, RowNo())), Branch, Month)
- Mark as New
- Bookmark
- Subscribe
- Mute
- Subscribe to RSS Feed
- Permalink
- Report Inappropriate Content
thanks mate it works.. i really i appreciate your help.. do you have any reference on Aggr and RangeSum iam researching on it im looking for just a simple explanation.
thanks
- Mark as New
- Bookmark
- Subscribe
- Mute
- Subscribe to RSS Feed
- Permalink
- Report Inappropriate Content
The issue is that RangeSum(Above()) accumulate for the second dimension (unless you have specified TOTAL which is not what you needed because then it accumulates regardless of your 1st dimension). Now the problem was that you had Month as your 1st dimension and Branch as your second dimension.... so the accumulation was taking place for Branch rather than accumulating for Months for a single branch. In order to fix this, we use Aggr() function where we supplied Branch as the first dimension and Month as the second dimension
=Aggr(RangeSum(Above(Sum({<GLHeader= {1}>} GLTOTAL), 0, RowNo())), Branch, Month)
Now there might have been a case where Month was not correctly sorted in the load script which can then be solved as mentioned here
- Mark as New
- Bookmark
- Subscribe
- Mute
- Subscribe to RSS Feed
- Permalink
- Report Inappropriate Content
Hi good day mate... sorry to ask again... the formula you refer to me works fine i already created multiple financial KPI's but after i check every details i notice something is wrong
the first chart is fine
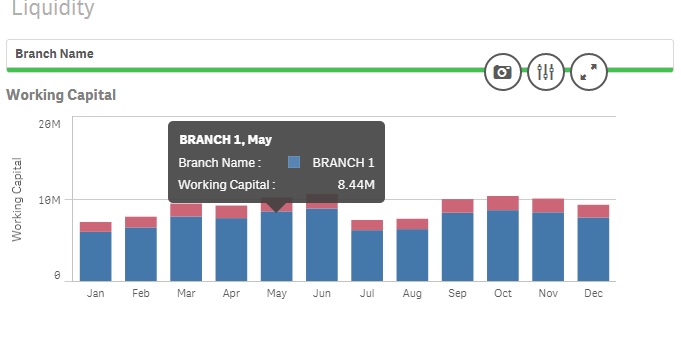
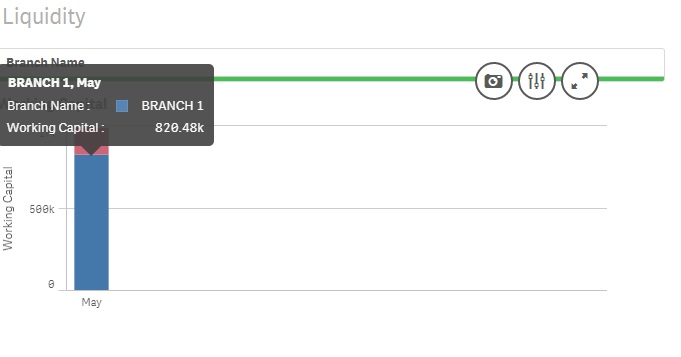
but after i select a specific month it does not aggregate from jan - up to the selected date.
i hope you can help me again, and your help is really really appreciated.
and sorry for keep on asking. i just don't have anybody to ask for help personally
thanks.
- Mark as New
- Bookmark
- Subscribe
- Mute
- Subscribe to RSS Feed
- Permalink
- Report Inappropriate Content
Did you select Branch or did it accidentally selected Month? May be try this
=Aggr(RangeSum(Above(Sum({<GLHeader= {1}, Month>} GLTOTAL), 0, RowNo())), Branch, Month)
- Mark as New
- Bookmark
- Subscribe
- Mute
- Subscribe to RSS Feed
- Permalink
- Report Inappropriate Content
it works mate.. now i have an additional idea on how rangesum works... thanks alot
- Mark as New
- Bookmark
- Subscribe
- Mute
- Subscribe to RSS Feed
- Permalink
- Report Inappropriate Content
how to get % of cumulative orders?
rangesum giving correct results and i need each cumulative value/(max of cumulative value)