Unlock a world of possibilities! Login now and discover the exclusive benefits awaiting you.

- Qlik Community
- :
- Forums
- :
- Analytics & AI
- :
- Products & Topics
- :
- App Development
- :
- Difficult Aggr with COUNT
- Subscribe to RSS Feed
- Mark Topic as New
- Mark Topic as Read
- Float this Topic for Current User
- Bookmark
- Subscribe
- Mute
- Printer Friendly Page

 Kakurin_Denis
- Mark as New
- Bookmark
- Subscribe
- Mute
- Subscribe to RSS Feed
- Permalink
- Report Inappropriate Content
Difficult Aggr with COUNT
Good afternoon, dear colleagues!
I have a problem in my project. Hope someone could give me an advice.
1) I am loading table from db with columns:
INN; FRAUD_RISK_ZONE;SCORE_DATE;RULESET
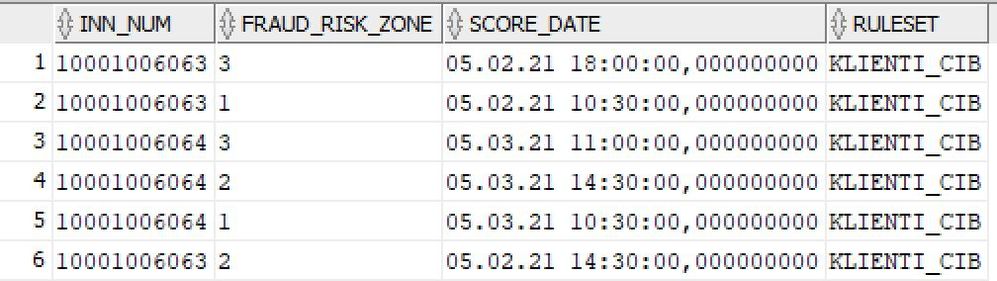
2) I want to make bar chart, where dimension is MONTH(SCORE_DATE). But the case is I should select
only row with last score_date in month. On SQL it looks like

In measure I tried COUNT(Aggr(distinct MAX(SCORE_DATE, MONTH, INN_NUM))).
but it works bad...because it doesn’t select correct FRAUD_RISK_ZONE.
this is the result:
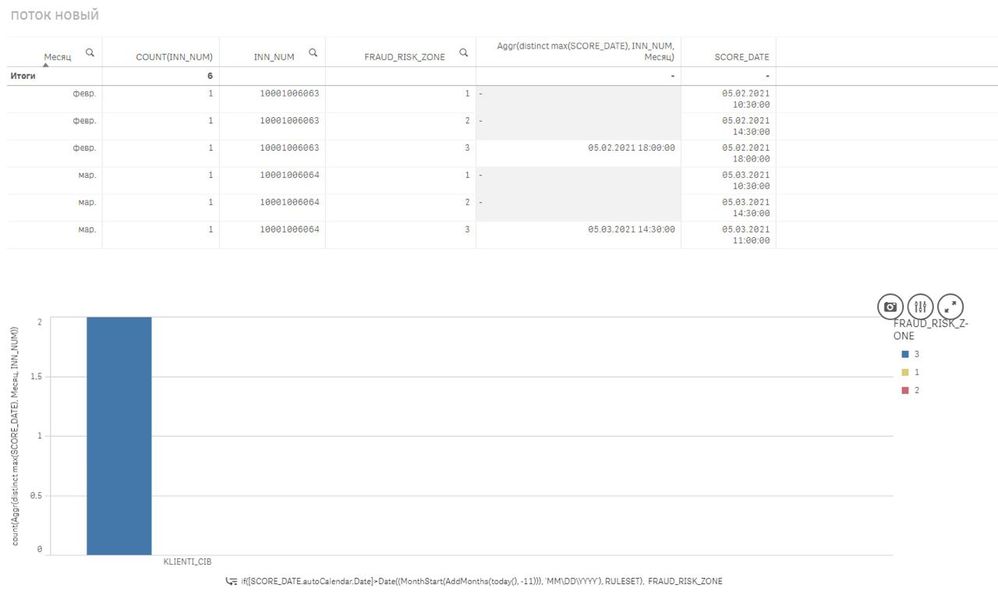
How I should write the measure that select rows with only max(SCORE_DATE)?
which takes only columns of this rows?
thank you!!!

 agigliotti
- Mark as New
- Bookmark
- Subscribe
- Mute
- Subscribe to RSS Feed
- Permalink
- Report Inappropriate Content
Hi @Kakurin_Denis ,
Which are your actual bar chart dimension and measure?
Follow me on my LinkedIn | Know Gamma Informatica at gammainformatica.it
Kakurin_Denis
- Mark as New
- Bookmark
- Subscribe
- Mute
- Subscribe to RSS Feed
- Permalink
- Report Inappropriate Content
I have 2 dimensions: RULESET and FRAUD_RISK_ZONE.
measure is COUNT(Aggr(distinct MAX(SCORE_DATE, MONTH, INN_NUM))).
agigliotti
- Mark as New
- Bookmark
- Subscribe
- Mute
- Subscribe to RSS Feed
- Permalink
- Report Inappropriate Content
could you post a sample app with mock data to take a look at?
Follow me on my LinkedIn | Know Gamma Informatica at gammainformatica.it

 mato32188
- Mark as New
- Bookmark
- Subscribe
- Mute
- Subscribe to RSS Feed
- Permalink
- Report Inappropriate Content
Hi Denis,
what if you try to use set analysis script to tweak your expression?
count ( {< SCORE_DATE = {"$(=Aggr(distinct MAX(SCORE_DATE, MONTH, INN_NUM)))"} >} xxxx)
BR
m
