Unlock a world of possibilities! Login now and discover the exclusive benefits awaiting you.
Announcements
Now accepting applications for the Qlik Luminary and Partner Ambassador Programs: Apply by July 6!
- Qlik Community
- :
- Forums
- :
- Analytics & AI
- :
- Products & Topics
- :
- App Development
- :
- Re: Hide mini chart when using continuous scale in...
Options
- Subscribe to RSS Feed
- Mark Topic as New
- Mark Topic as Read
- Float this Topic for Current User
- Bookmark
- Subscribe
- Mute
- Printer Friendly Page
Turn on suggestions
Auto-suggest helps you quickly narrow down your search results by suggesting possible matches as you type.
Showing results for
Contributor II
2018-09-27
09:45 AM
- Mark as New
- Bookmark
- Subscribe
- Mute
- Subscribe to RSS Feed
- Permalink
- Report Inappropriate Content
Hide mini chart when using continuous scale in line chart
Hello
Do you know if it's possible to hide mini chart when using continuous scale in line chart?
7 Replies
Creator III
2018-09-27
09:17 PM
- Mark as New
- Bookmark
- Subscribe
- Mute
- Subscribe to RSS Feed
- Permalink
- Report Inappropriate Content
Please try this
In Chart Property --> Presentation-> X axis -> uncheck 'Show mini Chart'
Regards
An Pham
3,292 Views
Contributor II
2018-10-02
03:13 PM
Author
- Mark as New
- Bookmark
- Subscribe
- Mute
- Subscribe to RSS Feed
- Permalink
- Report Inappropriate Content
'Show mini chart' is not an option in the line chart in QlikSense.
3,292 Views
Partner - Master III
2018-10-02
03:36 PM
- Mark as New
- Bookmark
- Subscribe
- Mute
- Subscribe to RSS Feed
- Permalink
- Report Inappropriate Content
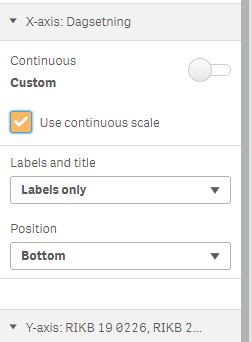
Chart Property --> Presentation-> X axis -> change Continuos to not Auto
then the minichart option will appear
uncheck 'Show mini Chart'
3,292 Views
Contributor II
2018-10-04
07:33 PM
Author
- Mark as New
- Bookmark
- Subscribe
- Mute
- Subscribe to RSS Feed
- Permalink
- Report Inappropriate Content
Thanks for your reply.
What version are you using?
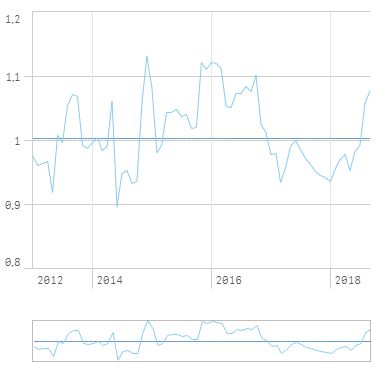
There is no mini chart option when change continuous not to auto as you can see on the picture.
3,292 Views
Partner - Master III
2018-10-04
07:38 PM
- Mark as New
- Bookmark
- Subscribe
- Mute
- Subscribe to RSS Feed
- Permalink
- Report Inappropriate Content
I am using Sept realise.
Which one are you on?
3,292 Views
Employee
2018-10-04
08:32 PM
- Mark as New
- Bookmark
- Subscribe
- Mute
- Subscribe to RSS Feed
- Permalink
- Report Inappropriate Content
This feature was released in June 2018 release
3,292 Views
Creator III
2019-01-03
05:39 AM
- Mark as New
- Bookmark
- Subscribe
- Mute
- Subscribe to RSS Feed
- Permalink
- Report Inappropriate Content
It seems still not workale?
I use Nov.2018 version.
I use Nov.2018 version.