Unlock a world of possibilities! Login now and discover the exclusive benefits awaiting you.

- Qlik Community
- :
- Forums
- :
- Analytics & AI
- :
- Products & Topics
- :
- Connectivity & Data Prep
- :
- Re: Map Visualisation
- Subscribe to RSS Feed
- Mark Topic as New
- Mark Topic as Read
- Float this Topic for Current User
- Bookmark
- Subscribe
- Mute
- Printer Friendly Page

- Mark as New
- Bookmark
- Subscribe
- Mute
- Subscribe to RSS Feed
- Permalink
- Report Inappropriate Content
Map Visualisation
Hello,
I am working with data that`s coming from syntaticmass. This is the query that i used in the REST connector in Qlik sense: https://syntheticmass.mitre.org/fhir/Patient?_count=100
What i am trying to do is to count the patients per city, but when i do this it refers to citys in different countries. The cities should refer to locations in the state Massachusetts in Amerika. I have also a state value 'MA', but qlik sense refers the value to Marocco.
When i only use the cities data. It gives me this:
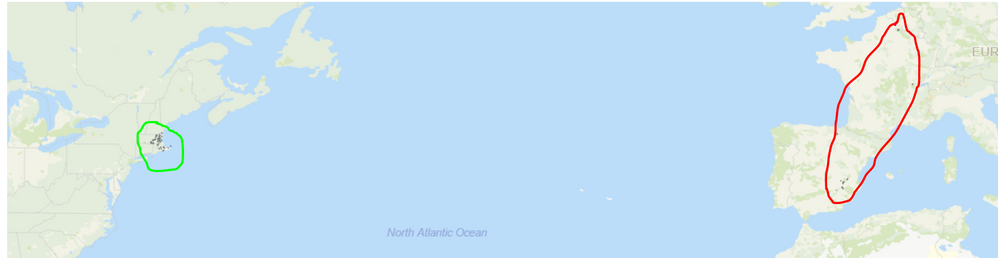
The cities in red should also be in the green circel, so what i tried to do is to add the state. The result what i got with this is:
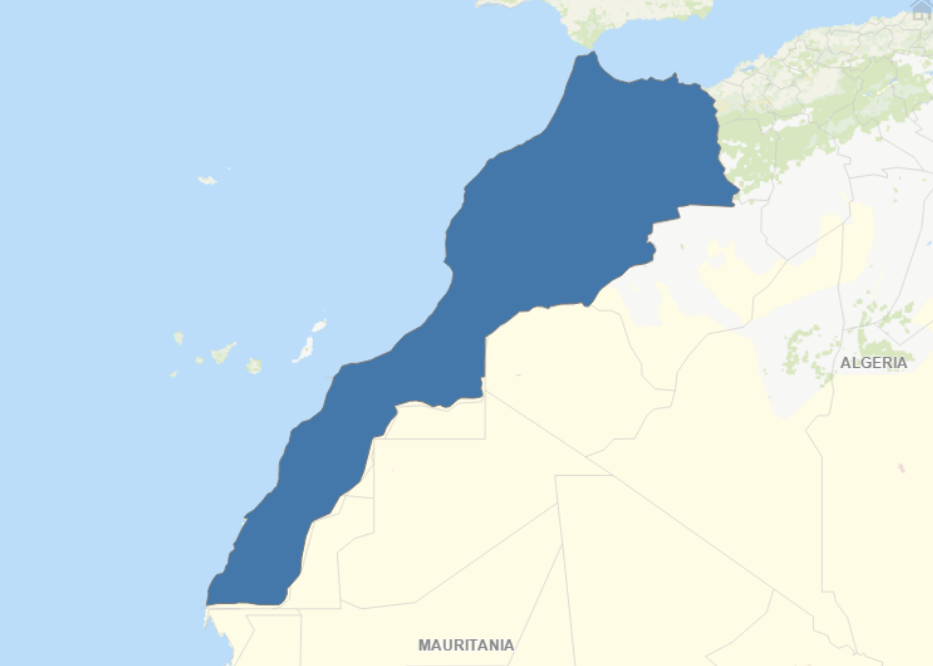
But what i really want is someting like this:
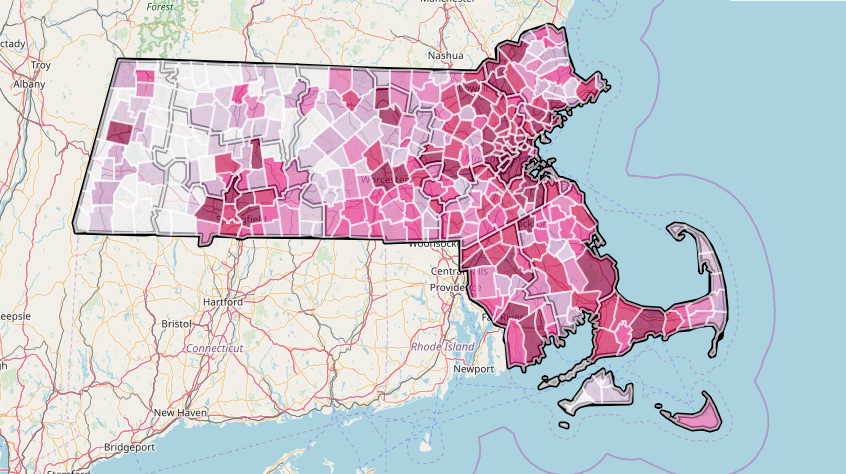
I have tried the things on the qlik sense help page for the settings of the map, but i think that i am not doing it right.
Is there someone that could help me with this?
Regards, Gino
- Tags:
- rest
Accepted Solutions

 lironbaram
- Mark as New
- Bookmark
- Subscribe
- Mute
- Subscribe to RSS Feed
- Permalink
- Report Inappropriate Content
Hi
in your map layer settings go to Location, then change the scope for location from auto to manual
in the menu that open
in the country type ='US'
in admin area1 type ='MA'
this should do the work for you
lironbaram
- Mark as New
- Bookmark
- Subscribe
- Mute
- Subscribe to RSS Feed
- Permalink
- Report Inappropriate Content
Hi
in your map layer settings go to Location, then change the scope for location from auto to manual
in the menu that open
in the country type ='US'
in admin area1 type ='MA'
this should do the work for you
- Mark as New
- Bookmark
- Subscribe
- Mute
- Subscribe to RSS Feed
- Permalink
- Report Inappropriate Content
Hi,
Thank you for your reply.
I did something wrong in the settings. Your suggestions works for me.
Regards, Gino