Unlock a world of possibilities! Login now and discover the exclusive benefits awaiting you.
- Qlik Community
- :
- All Forums
- :
- Connectivity & Data Prep
- :
- Re: Sum of Sales for Rolling 12 Months
- Subscribe to RSS Feed
- Mark Topic as New
- Mark Topic as Read
- Float this Topic for Current User
- Bookmark
- Subscribe
- Mute
- Printer Friendly Page
- Mark as New
- Bookmark
- Subscribe
- Mute
- Subscribe to RSS Feed
- Permalink
- Report Inappropriate Content
Sum of Sales for Rolling 12 Months
Hi All,
In Qlik Sense
I need Sum of Sales for Rolling 12 Months and also my Year Month needs to show only 12 months. Below is sample data please ignore the values and need to represented in line chart
In Line chart Year Month as X Axis and Sum of Rolling 12 Month Sales in in Y Axis.
I used rangesum(above(sum(sales)),0,12)) but on line Chart X Axis is dsiplaying all Year Month with null values which I dont want to show.
I need to show only 12 Months on X Axis and Sum of Rolling 12 Months. Any suggestions
I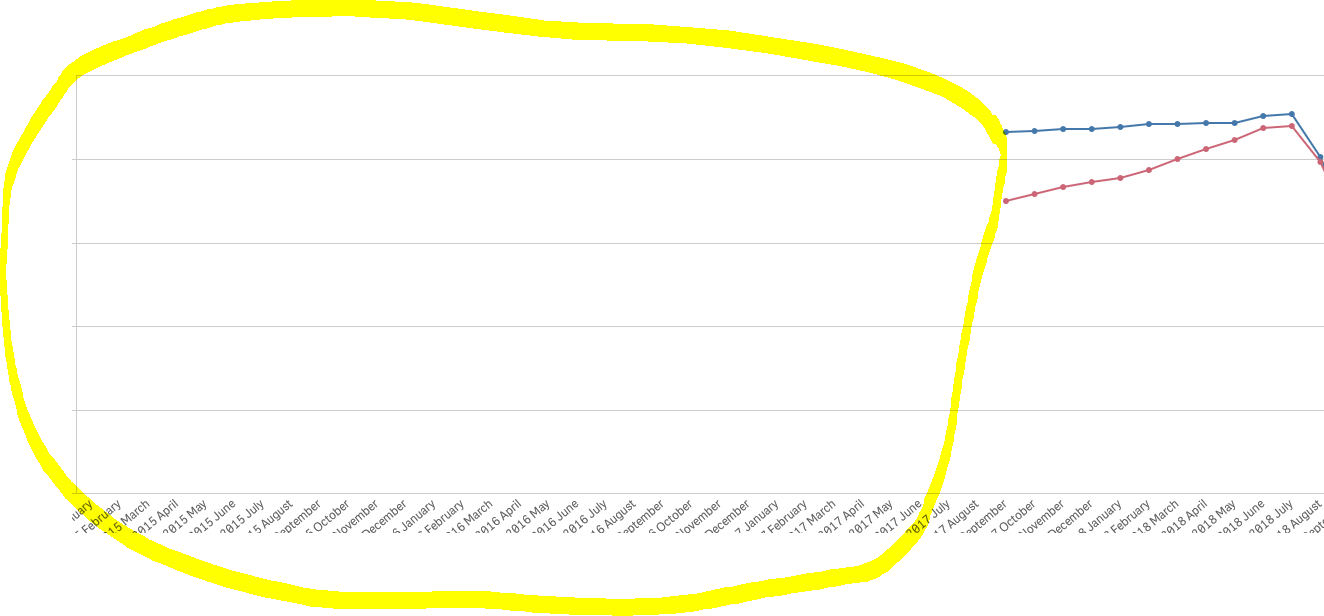
| Year Month | Sales | Sum of Rolling 12 months |
|---|---|---|
| 201609 | 5 | |
| 201610 | 20 | |
| 201611 | 15 | |
| 201612 | 10 | |
| 201701 | 5 | |
| 201702 | 20 | |
| 201703 | 15 | |
| 201704 | 10 | |
| 201705 | 5 | |
| 201706 | 20 | |
| 201707 | 15 | |
| 201708 | 10 | |
| 201709 | 5 | 150 |
| 201710 | 20 | 150 |
| 201711 | 15 | 150 |
| 201712 | 10 | 150 |
201801 | 5 | 150 |
| 201802 | 20 | 150 |
| 201803 | 15 | 150 |
| 201804 | 10 | 150 |
| 201805 | 5 | 150 |
| 201806 | 20 | 150 |
| 201807 | 15 | 150 |
| 201808 | 10 | 150 |
Thanks
Sridhar
Accepted Solutions
- Mark as New
- Bookmark
- Subscribe
- Mute
- Subscribe to RSS Feed
- Permalink
- Report Inappropriate Content
In the chart properties >> Add Ons >> Data Handling >> Uncheck Include Zero Values
- Mark as New
- Bookmark
- Subscribe
- Mute
- Subscribe to RSS Feed
- Permalink
- Report Inappropriate Content
Hi try this,
sum({1<OrderDate={">=$(=addmonths(monthend(max(OrderDate))+1,-12)) <=$(=max(OrderDate))"}>}Sales)
- Mark as New
- Bookmark
- Subscribe
- Mute
- Subscribe to RSS Feed
- Permalink
- Report Inappropriate Content
Hi Giovanne,
Still All Year Months as displayed in chart with value Zero. I need to display only Last 12 Months on X Axis and metric needs to be Sum of Rolling 12 Months for the corresponding month.
Thanks
Sridhar
- Mark as New
- Bookmark
- Subscribe
- Mute
- Subscribe to RSS Feed
- Permalink
- Report Inappropriate Content
In the chart properties >> Add Ons >> Data Handling >> Uncheck Include Zero Values
- Mark as New
- Bookmark
- Subscribe
- Mute
- Subscribe to RSS Feed
- Permalink
- Report Inappropriate Content
@Mark Perreault. It worked Thanks for your solution.
- Mark as New
- Bookmark
- Subscribe
- Mute
- Subscribe to RSS Feed
- Permalink
- Report Inappropriate Content