Unlock a world of possibilities! Login now and discover the exclusive benefits awaiting you.
- Qlik Community
- :
- All Forums
- :
- Connectivity & Data Prep
- :
- overlap values in Pie chart
- Subscribe to RSS Feed
- Mark Topic as New
- Mark Topic as Read
- Float this Topic for Current User
- Bookmark
- Subscribe
- Mute
- Printer Friendly Page
- Mark as New
- Bookmark
- Subscribe
- Mute
- Subscribe to RSS Feed
- Permalink
- Report Inappropriate Content
overlap values in Pie chart
Hello Can you help me to create a pie chart where the values are repeated in two names. Is it possible to generate a pie chart where we can see these values and also may be the exact values?
For example
Total = 18979
A=9217
B=4376
C=6086
D=5942
Here I donot know which numbers are overlapping to which name.
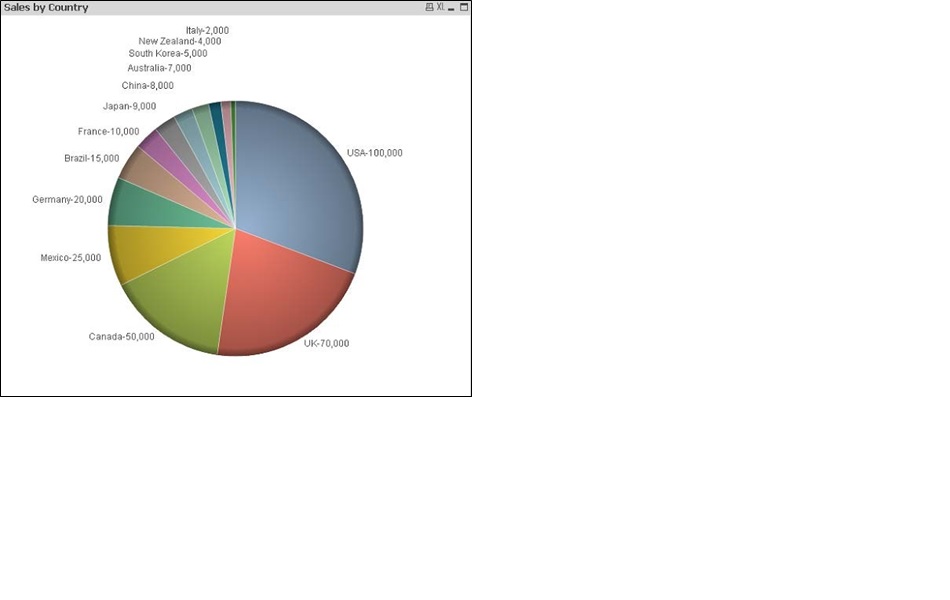
now I am getting a pie chart like this
Is it possible to get the chart with overlapping colors or something where i can show what numbers are voerlapped with what name.
Thank you in advance
Sachin
- Mark as New
- Bookmark
- Subscribe
- Mute
- Subscribe to RSS Feed
- Permalink
- Report Inappropriate Content
Are you looking for a solution like this ?
 Hi
Hi
- Mark as New
- Bookmark
- Subscribe
- Mute
- Subscribe to RSS Feed
- Permalink
- Report Inappropriate Content
Hello,
I dont think so. I want to show the overlapping values & also visualize in pie chart something like in transparent colors.
Total = 18979
A=9217
B=4376
C=6086
D=5942
for example
AC=500
AD=200
BC=150
BD=100
Thus i get a distinct
A,B,C,D
I hope its understandable.
- Mark as New
- Bookmark
- Subscribe
- Mute
- Subscribe to RSS Feed
- Permalink
- Report Inappropriate Content
May be a venn diagram or if it is possible to show in any graphical representation in Qlik sense.
- Mark as New
- Bookmark
- Subscribe
- Mute
- Subscribe to RSS Feed
- Permalink
- Report Inappropriate Content
=if(Aggr(Sum(1), Field)>0,'Selected: $(=Concat(DISTINCT Field, ', '))
- Mark as New
- Bookmark
- Subscribe
- Mute
- Subscribe to RSS Feed
- Permalink
- Report Inappropriate Content
I dont understand sorry.
I am using
Count(Distinct [Customer Name])
As i need to count the total customer name (total=18979) and show this number by type of customer (A,B,C,D)