Unlock a world of possibilities! Login now and discover the exclusive benefits awaiting you.
- Qlik Community
- :
- Blogs
- :
- Technical
- :
- Design
- :
- Aggregations and Function Classes
- Subscribe to RSS Feed
- Mark as New
- Mark as Read
- Bookmark
- Subscribe
- Printer Friendly Page
- Report Inappropriate Content
A typical QlikView application may have one million records in the data, one hundred rows in a pivot table and a single number, a KPI, in a gauge or text box. Although different in magnitudes, all three numbers may still represent all data. The numbers are just different aggregation levels.
There are many functions in QlikView that can help you write the necessary formulae to calculate aggregated KPI:s. Some will collapse many records into one value, others will not. Today I will write about the different function classes, and how you can combine them.
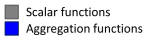
 The Scalar Functions constitute the first class. Typical for these is that they are one-to-one functions, i.e. they take a single value as parameter and return a single value (of the dual data type). Examples: Left(), If(), Num(), Date(), Year(), Subfield(), etc.
 The Aggregation Functions constitute the second class. These are many-to-one functions, i.e. they use the values from many records as input and collapse these into one single value that summarizes all records. Examples: Sum(), Count(), Avg(), Min(), Only(), Concat(), etc.
Aggregation functions are special: You must use one to collapse several records into one number – which means that you need them in pretty much any formula in QlikView: In Chart expressions, in Text boxes, in Labels, etc. If you don’t write an aggregation function in your expression, QlikView will assign one for you: It will use the Only() function.
Scalar functions can be used both inside and outside the aggregation function:
Date( Min( Date )
Money( Sum( If( Group='A', Amount ) ) )
There is one restriction: You can normally not use an aggregation function inside another aggregation function. Hence, you usually need every field reference to be wrapped in exactly one aggregation function.
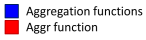
 The next function class has only one member: The Aggr Function. It is – in spite of its name – not an aggregation function. It is a many-to-many function, rather like a tensor or a matrix in mathematics. It converts a table with N records to a table with M records. In other words: It returns an array of values. Regard it as a virtual straight table with one measure and one or several dimensions.
Most places in QlikView demand that you write your expression so that it returns one single value. This means that you must wrap the Aggr function in an aggregation function to get a meaningful result. The only exception is if you use the Aggr function to define a calculated dimension or field. This means that you have two aggregation steps; one nested in the other:
Avg( Aggr( Sum( Amount ), Month ) )
Charts complicate the matters slightly: A chart is like a For-Next loop where the number of distinct dimension values determines the number of loops. In each loop, the expression must return one value only, and this is the value used for the bar/slice/pivot table row.
However, sometimes you need values from other rows in the chart, and it could even be that you need values from several rows. To solve this, there are two additional classes of functions that should be used together:
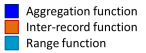
 The Chart Inter-record Functions return values fetched from other rows in the chart. Some of these can return several values, i.e. an array of values. These functions are only meaningful inside a chart or Aggr() function. Examples: Above(), Below(), Top(), etc.
 The Range Functions are functions that can collapse a chart inter-record array into one single value. Examples: RangeSum(), RangeMin(), RangeMax(), etc.
Example:
RangeSum( Above( Sum( Amount ), 0, 12 ) )
Bottom line: Know your functions. It will help you write correct expressions.
See also
You must be a registered user to add a comment. If you've already registered, sign in. Otherwise, register and sign in.