- Subscribe to RSS Feed
- Mark as New
- Mark as Read
- Bookmark
- Subscribe
- Printer Friendly Page
- Report Inappropriate Content
When analyzing data with Qlik Sense, you might have come across the need to compare two sets of selections side by side. This is where the Alternate States feature come into play, allowing you to create different sets of selections and compare them in the same dashboard. In this blog post, we'll walk through the process of performing comparative analysis using alternate states in Qlik Sense including how to create it, apply it, and we’ll dive into how we can synchronize selections between the default state and alternate states.
What are Alternate States?
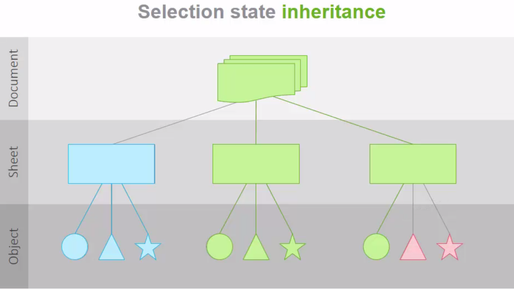
Alternate states in Qlik Sense can be thought of as multiple windows looking into the same app data model, allowing users to perform comparative analysis without losing or overriding other selections. Each state represents a unique perspective (For example, a Sales perspective, Operations, or Finance view) on the data, and these different windows or "states" can coexist within the same app without interfering with one another.
The normal operation of Qlik Sense involves a default state that affects the entire app when selections are made since every object in each sheet inherits from this state. However, this inheritance can be broken by creating new states for either sheets or individual objects, allowing them to exist independently and enabling side-by-side comparisons of charts. In this way, selections on different objects on the same sheet can co-exist without interfering with one another. This allows for having side-by-side comparison of charts.
Setting up the Alternate States
Let’s create two states for our example:
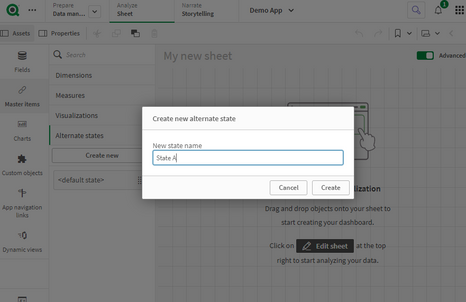
- Click on “Master Items” then ‘Alternate States”
- Select “Create new”
- Enter “State A” as the name.
Keep in mind that there are some naming limitations:
- Do not use $, 0, or 1 as a state name.
- Do not use a state name starting with $ or $_ followed by a number (for example $3).
- Do not use a state name already used as a bookmark name.
- Repeat the same for the second state and name it “State B”
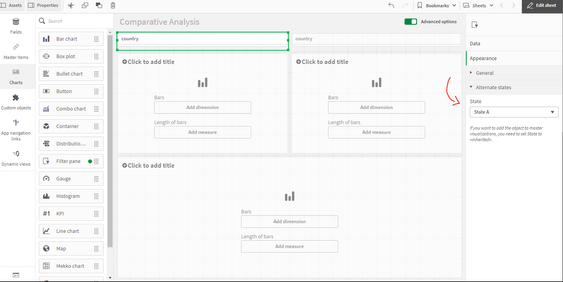
- Add 2 filter panes with the “Country” field and 3 bar charts
- For each filter pane, go to Appearance > Alternate Sates and select State A and State B respectively.
- In the 2 bar charts, add “Country” as a dimension and “count of distinct Orders” as a measure.
Notice that now, if you try and make a Selection in either filter pane, nothing will happen to the Bar charts, that is because the selections are made to the newly created Alternate States whereas the bar charts are still in the default state.
Applying Alternate States
In order to make the selections on the Alternate states affect the visualization objects, we need to link them to these alternate states. We can do that in a variety of ways:
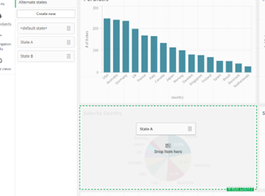
1- You can drag the newly created state from the left sidebar onto the visualization
2- You can go to the properties of the visualization, and under Appearance > Alternate states, choose the appropriate state from the dropdown (similar to what we did on the filter panes).
3- You can use Set Analysis to add the alternate state to the measure. Let’s use the following expression in our bar charts:
Count({[State A]} distinct orderID)
Count({[State B]} distinct orderID)
Bonus: Dynamic title for the Bar Charts.
If you want the title of the bar chart to reflect the selections of the respective alternate state, you can use the following expression:
='# of Orders '&GetCurrentSelections(chr(13)&chr(10), ': ', ',', 9, 'State A')
This will get the current selections in State A and comma separate them. Repeat this for State B.
Using Set Operators with Alternate States
It’s possible to use Set Operators (+, *, -, /) with states, meaning that we can do intersections, unions, exceptions etc... For example:
- Count({$ + [State A]} distinct orderID) -> will count the distinct orders in the union of the “Default” state and the alternate state “State A”.
- Count({1 - [State A]} distinct orderID) -> will count the distinct orders NOT in “State A”
- Count({[State A] * [State B]} distinct orderID) -> will count the distinct orders that are both in the intersection of ”State A“ and “State B”
Keep in mind that you should be cautions when using set operators in this manner. In some situations the result will not be what is expected. This is because the selections in a given state generate a set of data that may not be fully compatible with the set(s) it is being combined with. This is especially true as the complexity of the data model increases.
Synchronizing Selections between the Default state and Alternate States
When doing comparative analysis, you might run into a case where for instance you have 2 alternate states A and B, as well as the Default state.
Let’s say that we have 3 filter panes based on the field “Country” that have states A, B, and Default. In addition to that, we have 2 more filter panes with fields “Year” and “Month” that only have state Default.
If we’re only comparing Countries, we would be fine to make selections in all 3 “Country” filter panes to compare.
However, if we make a selection in either “Year” or “Month” filter panes which are only in the Default state, we can no longer see a clear comparison. So how can we solve that?
It’s simple, we can tweak the expressions in our 2 “alternate state”-bound measures to the following:
Count({[State A]<[orderDate.autoCalendar.Year] = $::[orderDate.autoCalendar.Year], [orderDate.autoCalendar.Month] = $::[orderDate.autoCalendar.Month]>} distinct orderID)

Count({[State B]<[orderDate.autoCalendar.Year] = $::[orderDate.autoCalendar.Year], [orderDate.autoCalendar.Month] = $::[orderDate.autoCalendar.Month]>} distinct orderID)
Notice that we have added the following set analysis syntax for both "Year" and "Month":
[orderDate.autoCalendar.Year] = $::[orderDate.autoCalendar.Year]
This means that we can keep selections for "Year" and "Month" consistent between states because when we select “Year” and “Month” in the Default states, these selections will be automatically applied to our Alternate States!
Conclusion
Comparative analysis is an essential tool for data analysis. Using alternate states in Qlik Sense makes it possible to compare two different sets of selections side by side. You can also go beyond the basics and leverage the power of Set Analysis to include Set operators or to automatically sync fields across states.
Attached is a QVF that has the example we went through!
Thanks for reading.
You must be a registered user to add a comment. If you've already registered, sign in. Otherwise, register and sign in.


