Announcements
Have questions about Qlik Connect? Join us live on April 10th, at 11 AM ET: SIGN UP NOW
hic
Former Employee
Former Employee

Several aspects of the Qlik search mechanism has been described in previous posts. There is however one that has not been covered: Search in dual fields, e.g. dates. This post will try to explain the basics.

When making searches in text fields, you can search either by using a normal search or by using a wildcard search, and when you search in numeric fields you can use a numeric search. But what about dual fields, like dates, where you have both a textual and a numeric representation?

The answer is displayed in the picture below.

search h.png

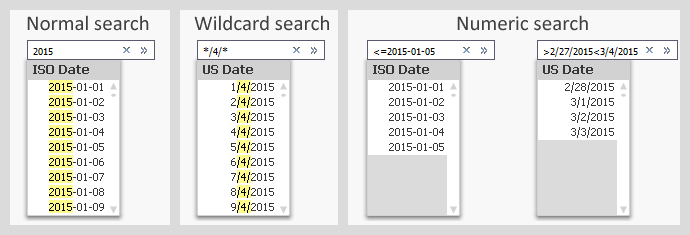
Normal searches and wildcard searches are straightforward and need not be explained. Numeric searches are also possible and do pretty much what you expect them to.

You should however note that the search string in a numeric search must contain the correct formatted date. It is in most cases not possible to use the numeric value of the date. E.g. you cannot search for 42005 when you want Jan 1st 2015, even though this is the value of the date.

The same logic is used in Set Analysis, which means that a correct Set Analysis expression with a date could look like this:

Sum( {$<Date={"<=2015-02-28"}>} Amount)

Often you want the Set Analysis expression to be dynamic, and then you need to put a dollar expansion with an aggregation function inside it. One case is that you want to compare the selected month with the preceding month. In principal, the solution is something similar to the following:

Selected (Last possible) month:     Sum( {$<Month={"$(=Max(Month))"}>}  Amount )
2nd Last month:                                    Sum( {$<Month={"$(=Max(Month)-1)"}>}  Amount )

The Max(Month) will calculate the last possible month, and the dollar expansion will enter this value into the expression before the expression is parsed.

How the expression looks after the dollar expansion can be seen in the column header of a QlikView table. The above formulas have been used in the table below. Note that the dollar expansions with Max(Month) have been replaced with numbers.
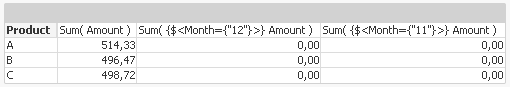
QV Table.png

So far, so good.

However, the above formulas will not work. First, if you have created the Month using the Month() function, the field is cyclic which means that December of one year has a higher numeric value than January the following year, although it comes before January. Hence, the Max() function will not respect the order of months belonging to different years.

Secondly, the Month field has a dual value. This means that the Max(Month) will return a numeric when you need the textual value (‘Dec’) in the Set analysis expression.

One solution is to use a sequential month instead, and format it the same way everywhere:

Script:

Date(MonthStart(Date),'MMM-YY') as Month,

Expressions:

Sum( {$<Month={"$(=Date(Max(Month),'MMM-YY'))"}>} Amount )
Sum( {$<Month={"$(=Date(AddMonths(Max(Month),-1),'MMM-YY'))"}>} Amount )

Here the field Month is a date - the first day of the month - but formatted with just month and year. In other words: A number that equals roughly 42000 and is formatted as ‘Jan-15’. The same formatting is applied inside the dollar expansion. Note the column headers below.

QV Table2.png

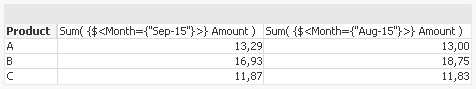
Often it is practical to put the calculation of the Set analysis condition in variables. This way, the formula is kept in one place only and the Set analysis expressions become simpler and easier to read:

Script:

Set vLastMonth=      "=Date(Max(Month),'MMM-YY')";
Set v2ndLastMonth= "=Date(AddMonths(Max(Month),-1),'MMM-YY')";
Date(MonthStart(Date),'MMM-YY') as Month,

Expressions:

Sum( {$<Month={"$(vLastMonth)"}>} Amount )
Sum( {$<Month={"$(v2ndLastMonth)"}>} Amount )

Note that the variable definitions start with equals signs. This way they will be recalculated at every click.

Summary: Format the dates used inside Set analysis expressions, and use variables to simplify the expressions.

HIC


Further reading related to this topic:

The Search String

Data Types in QlikView

Cyclic or Sequential?

A Primer on Set Analysis

32 Comments
bvssudhakar
Creator III
Creator III

Hello hic,

I have table with multiple date columns (nearly 5 date columns are there), Now I want create one master date column for all of them because in my report i can't to show multiple list boxes for the user. If i show like that user will get confuse.

Example: i am creating one bar chart/table for title name wise placements for this i use title name as dimension and =Count({<plcdate = {"*"}>}CandidateID) as expression

and now i have to create one list box for plcdate column

And now, again i am creating one bar chart/table for title name wise Declines for this i use title name as dimension and =Count({<Declinedate = {"*"}>}CandidateID) as expression

for this i have to create one more list box for Decline date column


Again i am creating one bar chart/table for title name wise Offered Candidates for this i use title name as dimension and =Count({<Offerdate = {"*"}>}CandidateID) as expression

for this i have to create one more list box for offer date column


But user is not accepting these many list boxes separately. they want only two list boxes year and month or hierarchy calendar list box that will apply to all date columns

So, How to handle this issue i am not understanding. I have visited some threads also those are not useful for me

Please suggest some solutions and help me out from this

Thank you in advance

0 Likes
14,063 Views
hic
Former Employee
Former Employee

Take a look at Canonical Date I think that this could be a way forward.

HIC

0 Likes
14,063 Views
pradeepsagwal
Contributor II
Contributor II

Hello hic‌ and friends

I want to use the same formulae but within terms of a fiscal year.

I am using you script for fiscal year.

How to get FYearMonth ??

dual(fYear & '-' & FMonth,Date(MonthStart(Date,$(vFM))))  as fYearMonth,

dual(  FMonth & '-' & fYear,Date(MonthStart(Date,$(vFM))))  as fMonthYear,

Above are not working when I am using

=date(max(fYearMonth),'MMM-YY') in text object/

It  gives Dec-18 whereas by maximum date is 08/20/2018.

Thanks in advance

Sagwal

0 Likes
14,063 Views
beck_bakytbek
Master
Master

very helpful, thank a lot for sharing

0 Likes
14,057 Views
Tautvydas
Partner - Contributor

Hello everyone,

I am finding some difficulties with the dates in Set Analysis expressions.

Maybe someone of you could help.


I have data which includes products and the date when they where moved to the specific location.

I would like to have an option to choose specific date from list and see how many products where moved in that specific location until that date, i.e. min date is 2010-01-01, max date is 2018-01-01, if I choose 2016-05-24 I would like to see how many products were moved in that location from 2010-01-01 until 2016-05-24.

I already made a list box for selecting dates,  variable "vSelectedDate=GetFieldSelections(Date field)" which is taking the value from that list box and storing in variable, but now I am struggling with set analysis expression.

I tried to write it like "sum({<InDate<={"<=$(vSelectedDate)"}>}Quantity)", but it doesn't work properly.

I hope someone of you could suggest something.

Thanks in advance.

0 Likes
12,343 Views
Yury
Contributor II
Contributor II


is it possible to change "1" to a variable that depends on dimensions in pivot table?

"=Date(AddMonths(Max(Month),-1),'MMM-YY')";

I want to use following expression in set analysys to get SUM for different periods... (month, year, half year etc)

0 Likes
10,757 Views
kalyandg
Partner - Creator III

Hi HIC,

I have a requirement to calculate no. of Documents, with condition DeliveryDate < OrderDate.

If I write the expression as if condition -  I am getting 200 no.s 

count(if(DeliveryDate<OrderDate, DocumentNo)) 

But when I tried in set analysis

count({<DeliveryDate={"<$(OrderDate)"}>}DocumentNo) - i am getting more no.s - 800

Both dates are from same table - format is DD/MM/YYYY

I am not able to fix my set analysis issue. Please correct me if I was wrong in my set analysis expression.

Thanks and Regards,

Kalyan

0 Likes
1,188 Views
CurtDaughtryBP
Contributor III
Contributor III

@kalyandg Maybe try with an equal sign within the variable expansion

count({<DeliveryDate={"<$(=OrderDate)"}>}DocumentNo) 

1,173 Views
barnabyd
Partner - Creator III

G'day Kalyan,

I don't think you need the '$(...)' around the date. The set analysis in the article above is using this to evaluate the various functions. However, you are not using any functions. Here's my solution:

count( {< DeliveryDate = {"<OrderDate"} >} DocumentNo )

Cheers,

Barnaby

P.S. My solution is based on this page, but the difference is that it uses a variable where you are using a column from your table.

P.P.S. I don't use set analysis very much, so I'll be interest if we get an answer from a guru in this field.

1,163 Views
robert99
Specialist III
Specialist III

Hi @Anonymous 

TRAP 1. When not to use Set Analysis

Example. For example comparing 2 dates

https://community.qlik.com/t5/Qlik-Sense-App-Development/P-and-E-Syntax-issue/td-p/106074

Henric_Cronström

Employee 2018-10-23 10:16 AM

Generally, set analysis cannot be used for a row-by-row comparison this way. The solution with the If() function will work fine, though.

Example from service App where OnTime is measured.

à Count(if  (Call_Resp_Hr + Call_Resp_Min/60 + Call_RHold +1/14400 ) >= Call_RTime,  Call_Num)

Another alternative is to set OnTime up in script

  if ( (Call_Resp_Hr + Call_Resp_Min/60 + Call_RHold +1/14400 ) >= Call_RTime , ‘Yes’,’No’) as Ontime

and then use set analysis as  {<OnTime = {‘Yes’} >}

1,150 Views