Unlock a world of possibilities! Login now and discover the exclusive benefits awaiting you.
- Qlik Community
- :
- Blogs
- :
- Technical
- :
- Design
- :
- Is it a string or a number?
- Subscribe to RSS Feed
- Mark as New
- Mark as Read
- Bookmark
- Subscribe
- Printer Friendly Page
- Report Inappropriate Content
I am sure that I am not the only one who has added a filter pane to their Qlik Sense app and found a combination of strings and numbers when you were expecting all numeric data. This happened to me recently when I was building an app that had many data sources. I was loading a year field from each of the data sources but I soon realized that the data I was loading was not always numeric. So when I added a filter pane to my app and added the dimension year, I ended up with a list like the image below (on the left). Some of the years were left-aligned and some were right-aligned.
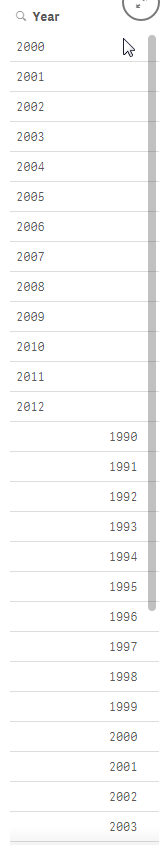
One of my data sources had years from 2000 to 2012 which were loading as strings (left-aligned) while my other data source had years from 1990 to 2014 that were right-aligned. My obvious problem is I want each year listed once and to be consistent across all my data sources so that when a user wants to select 2010, they do not have to select both the string and numeric representation of the year.
Part of the script that loaded these files looked like this:
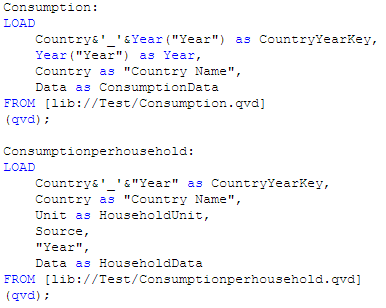
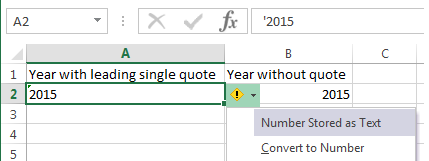
After some testing I realized that the second table shown above, Consumptionhousehold, was where the string year values were coming from. I did not generate the QVD being used for this app but I have found that sometimes numeric values are loaded as strings if there are additional characters in the original field. For instance, in Excel, a year column may be stored as text if there is a leading single quote. If you look at the image below, you can see that the year in column A is stored as text because it starts with a single quote (‘2015). In column B, the year is numeric because it is just numbers. When both these values are loaded into Qlik Sense, they are evaluated differently and can lead to problems.
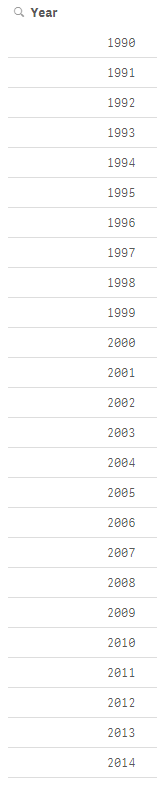
To resolve this issue I modified my script to evaluate the string year as a date by using the Date# function and then I added the format parameter (‘YYYY’) to indicate how the year is formatted (see image below). Going forward, I added this modification to my script every time I loaded year just to be on the safe side. You can read more about the Date function in blog titled The Date Function.

Once this modification was made I ended up with a list of years from 1990 to 2014 and they were all right-aligned and listed only once.
While this is a small problem, it can cause confusion when you are building an app especially if you do not realize it has happened. I noticed the issue because I added a filter pane to my app but had I not done that and tried to use the year field in a chart or in set analysis, my results would have been incorrect. The lesson I took from this is to always check to make sure that the data I am loading is loading as expected. I can easily test this by adding filter panes to my app or looking at the data model viewer to ensure that everything is loaded as planned. Good luck scripting.
Thanks,
Jennell
You must be a registered user to add a comment. If you've already registered, sign in. Otherwise, register and sign in.