Unlock a world of possibilities! Login now and discover the exclusive benefits awaiting you.
- Qlik Community
- :
- Blogs
- :
- Technical
- :
- Design
- :
- Maps and Mazes: A Tale of Two Extensions
- Subscribe to RSS Feed
- Mark as New
- Mark as Read
- Bookmark
- Subscribe
- Printer Friendly Page
- Report Inappropriate Content
The highly respected (fictional) scientist, Ian Malcolm, once chastised a group of scientists for being “so preoccupied with whether or not they could that they didn't stop to think if they should.” Ignoring the fact that this statement was made in regard to ferocious dinosaurs that would soon terrorize mankind, there is truth held within for how we approach technology.
In this business we’ve all been guilty at one time or another of using the “more is more” approach in data visualization. All too often we marvel at something that dazzles without stepping back for a minute to consider the story that’s actually being told by the data. This is especially true with QlikView extensions.
There are a plethora of JavaScript libraries that display data in exciting and dynamic ways. It flies here and there, spins, zooms, explodes, and distracts attention for a bit before the viewer attempts to decipher the information loosely assembled in the chaos. With extensions we sometimes jump at the opportunity to cram a hot, buzzy technology into QlikView simply for the bragging rights. Sometimes what is needed is something much simpler.
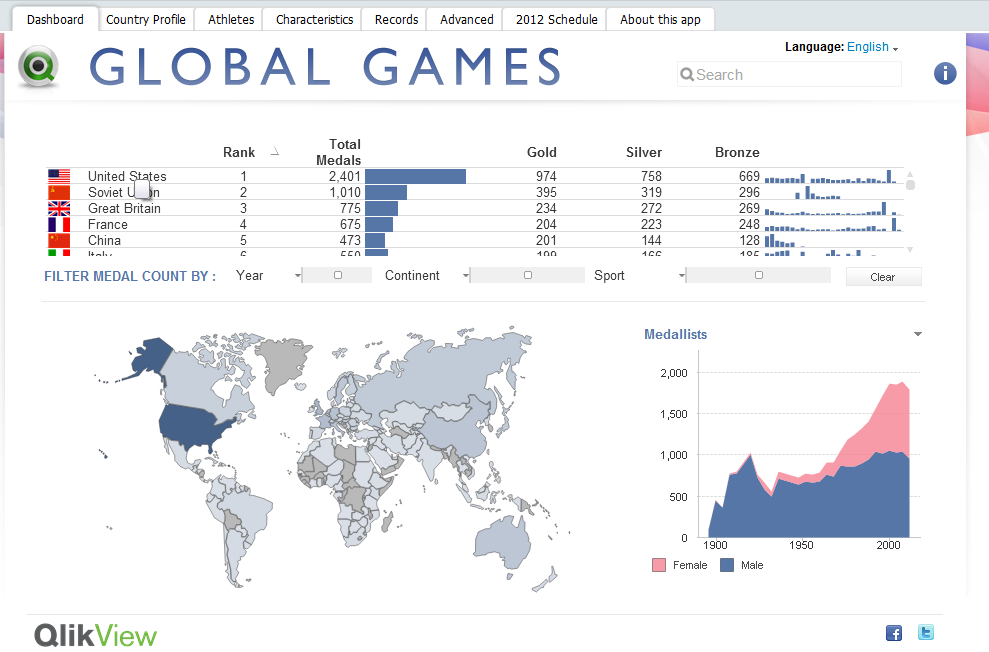 When I began working on an extension to visualize medal counts for the Olympic Games this past summer, it was assumed that I would use a slick mapping UI similar to Google Maps or OpenLayers. These powerful mapping tools allow developers to perform a wide variety of complex geospatial tasks, taking into account curvature of the earth, map projections, tessellation, and a variety of other things that will induce sleep in the average human being.
In order to achieve the effect of highlighting and coloring the different countries for this extension, it is not as simple as telling the Google Maps API to select country X and highlight it with color Y. These mapping tools do not have country or region boundaries prepackaged. Due to this fact, the actual longitude and latitude points for the boundaries of each and every country would need to be found and plotted as shapes on the map. Not only is this a LOT of data for JavaScript to handle, geographical data is not easy to come by.
So, let’s take a step back. The question that needs to be asked is how much additional detail will users need? The data we’re looking to visualize is not geographic in a technical sense. We only need to display the countries of the world as concepts and entities, not as precise geographic objects. In this case, the precision offered by the mapping tool is completely irrelevant, as is the map itself beneath the plotted shapes. Why repurpose a complex and powerful mapping tool to draw a picture? Instead, why don’t we just, you know, DRAW A PICTURE?
Fine, but how do we do that? Enter SVG. SVG (or Scalable Vector Graphics) is a form of vector imagery in XML format which draws shapes and lines as a series of paths. While this format is not supported by all browsers (ahem…Internet Explorer), fortunately there is a JavaScript library called Raphaël that will draw SVG paths in old and new browsers. Finding an SVG of the countries of the world was relatively easy, and from that point, I leveraged Raphaël in drawing the image.
Rather than explain further in great detail how I coded and created this extension, what’s more important is to emphasize the need to consider the goals of our data visualizations. Just because we’re showing a map, must we use a mapping tool? Clearly not, and by drawing the world map as SVG, we used the appropriate tool. Our visualizations should yield to the data. If the data is trying to tell a story, we should get out of the way and let it tell its tale.
For a more in depth and technical overview of the extension, please click here for a zip file containing the extension and a technical brief.
You must be a registered user to add a comment. If you've already registered, sign in. Otherwise, register and sign in.