Unlock a world of possibilities! Login now and discover the exclusive benefits awaiting you.
- Qlik Community
- :
- Blogs
- :
- Technical
- :
- Design
- :
- Qlik Sense Custom Report
- Subscribe to RSS Feed
- Mark as New
- Mark as Read
- Bookmark
- Subscribe
- Printer Friendly Page
- Report Inappropriate Content
Four years ago, I wrote the Customizable Straight Table blog illustrating how you can build a custom table in QlikView. Last year, I wrote the Custom Report Extension blog that shows how to use the Climber Custom Report in Qlik Sense. Today, with the help of Patric Nordstrom and Jason Michaelides, I am going to blog about how you can build a custom report in Qlik Sense. With continued enhancements to the Qlik Sense table such as column show conditions and the ability to change the column order of a table, building a custom report in Qlik Sense is possible right out-of-the-box.
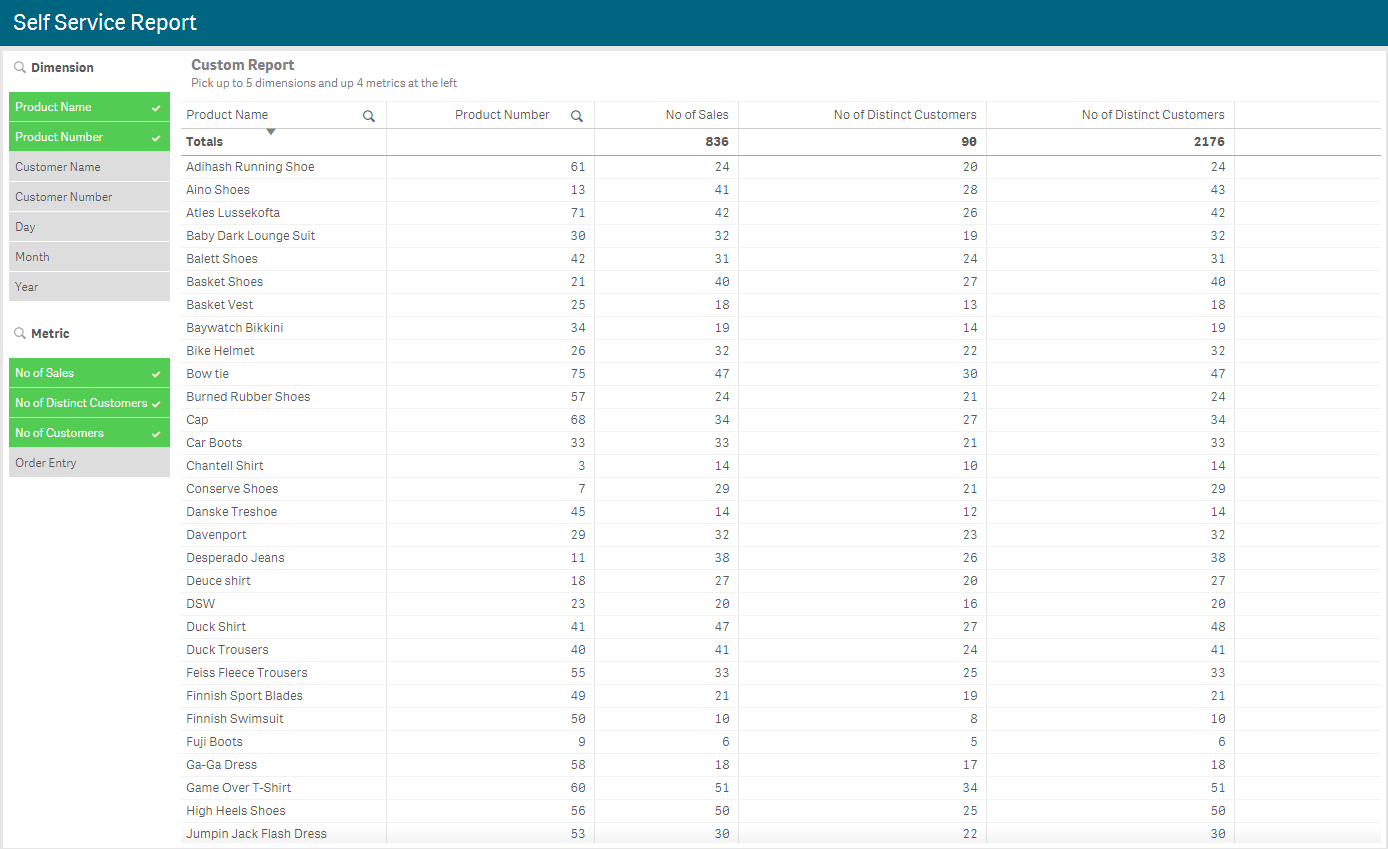
Patric built the attached Qlik Sense app that illustrates how to build a custom report in Qlik Sense. In this blog, I will review the steps needs to build your own report. Below is an example of how the report looks with some dimensions and metrics selected. On the left there are two filter panes, one for the dimensions and one for the metrics, that can be used to select the columns you would like to see in the report. Then there is the table which by default will be empty and will prompt the user to select the dimensions and metrics. In this example app, the user is encouraged to select no more than 5 dimensions and 4 metrics.

Let’s start by looking the script. You would load your data as usual but what you will need to add to the data model is a data island for the dimensions and for the metrics. In the script below, you can see how Patric did it, providing very clear details of each dimension and metric. The first field in each table is the dimension/metric grouping, the second field is the dimension/metric name as it will appear in the filter panes. The third field is a number to represent the default order of the dimension/metric columns in the report and the last field is description data about the dimension/metric. The KPIs table has a fourth field that shows the formulas for the metrics.

Once the app is loaded with the data islands, you can begin to build the custom report. You will need to add two filter panes and a table to your sheet. The Dimension filter pane uses the Dimension field and the Metric filter pane uses the Metric field. In the table, you will add 5 dimension columns and 4 measure columns since that is what is encouraged in this example. Now here is where Patric used Jason’s FirstSortedValue trick. For the first dimension, enter the text below in the Field.

And this in the Label:

So, you may be wondering what the expression is doing. Basically, the Dimension field is being sorted by the DimensionNo field and then, since the third rank parameter is being used, the expression returns the Dimension for the nth sorted value. In the report screenshot above, the dimensions Product Name and Product Number were selected. When you sort these by DimensionNo, Product Name comes before Product Number since 3 comes before 4 and when you rank these by their sorted value, Product Name is first and Product Number is second. This same idea was used in all the dimensions as you can see in the second dimension shown below.

The measures are done in the same manner. Below is the Field and Label for the first measure and the additional measure columns will follow the same concept as the dimension columns.
Field

Label

Now the last step is to add a conditional show to the columns. Basically, you only want the column to show if there is a dimension and/or metric selected to be displayed. For the first dimension column, you will set the “Show column if” property to:

For the second dimension, it will be the same except if greater than or equal to 2 and so on. The first measure will have the “Show column if” property set to:

Additional measure columns will follow the same format as described above for dimension columns.
Once all the columns are added and the properties are applied, the user can select the dimensions and metrics they would like to see in the report. By default, the column order will be based on the DimensionNo field but feel free to drag columns in the table to a new position. For more information on how Jason used FirstSortedValue, check out his document or Qlik Sense Help.
Thanks,
Jennell
- « Previous
-
- 1
- 2
- Next »
You must be a registered user to add a comment. If you've already registered, sign in. Otherwise, register and sign in.